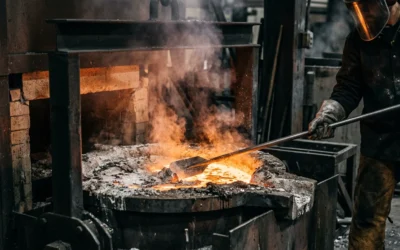
A ruined casting tells a story — you just have to know how to read it. Those voids, pits, and internal cavities scattered through your part aren’t random. They’re symptoms. Misread them, and you chase the wrong fix, waste pours, and lose customers.
Shrinkage porosity vs. gas porosity is one of the most critical distinctions a foundry engineer or buyer needs to master. Yet these two defects get confused on the shop floor all the time. They look similar. Both compromise structural integrity. But they form through distinct mechanisms — and each one demands a different solution.
What Is Gas Porosity in Casting? (Definition & Core Mechanism)
At 700°C, liquid aluminum holds dissolved hydrogen — up to 0.3–0.5 ml per 100g of metal. Then solidification hits. Solubility collapses to near zero. The gas has nowhere to go. It forms bubbles, gets locked behind advancing dendrites, and stays there as rounded voids inside your part.
That’s gas porosity in one sentence: trapped gas that couldn’t escape before the metal froze around it.
Where the Gas Comes From
Three sources drive most cases:
-
Hydrogen — absorbed from moisture in the air, wet scrap, or furnace atmosphere. Aluminum’s pull toward hydrogen runs up to 10× higher than steel. One wet charge can contaminate an entire heat.
-
Core binder breakdown — organic binders start breaking down above 200°C. They release CO, CO₂, and H₂ straight into the mold cavity.
-
Entrapped air — turbulent filling in die casting (piston speeds above 50 m/s) pushes air into the cavity by force. That air expands 100–200× as the metal solidifies.
What It Looks Like in Practice
The defects are easy to spot: round, smooth-walled voids, most between 0.05–2mm in diameter. Core gas blowholes run larger — 5–20mm — and show up close to core surfaces.
The production numbers are brutal. In aluminum automotive castings like cylinder heads, gas porosity alone drives 10–30% rejection rates. Parts fail under 200–300 MPa stress loads. Pressure leak rates push past spec thresholds of 1 cc/min. Switch a die casting operation to second-phase too early, and trapped air can account for 15–25% porosity volume in the gate region alone.
One number worth locking in: hydrogen content above 0.15 ml/100g in aluminum produces visible porosity. Every single time. No exceptions.
What Is Shrinkage Porosity in Casting? (Definition & Core Mechanism)
Metal lies to you during solidification. It looks whole. Then it cools — and the truth shows up as cavities.
Here’s the physics: metal contracts as it moves from liquid to solid. Aluminum shrinks 3–7% by volume. That contraction has to go somewhere. Liquid metal can’t always feed fast enough into isolated regions. So voids form. That’s shrinkage porosity — not a process error, but a physics problem with a process solution.
Three Forms, Three Failure Modes
Shrinkage porosity isn’t one defect. It’s three:
-
Closed shrinkage (internal porosity) — angular cavities buried inside the casting, concentrated at hot spots. These form in the first stage of solidification. Feeding paths are still open, but the flow is too slow to fill the gap.
-
Open shrinkage (surface pipe) — visible collapse on the surface. The casting caves inward where feeding paths are blocked. You can see it. You can’t fix it after the pour.
-
Sponge shrinkage (microshrinkage) — the dangerous one. Fine pores spread through thick mid-section areas. Alloys with a wide crystallization range produce this type near the end of solidification. It’s hard to spot. Easy to overlook. Under pressure, it can cause complete failure.
Where It Happens — and Why
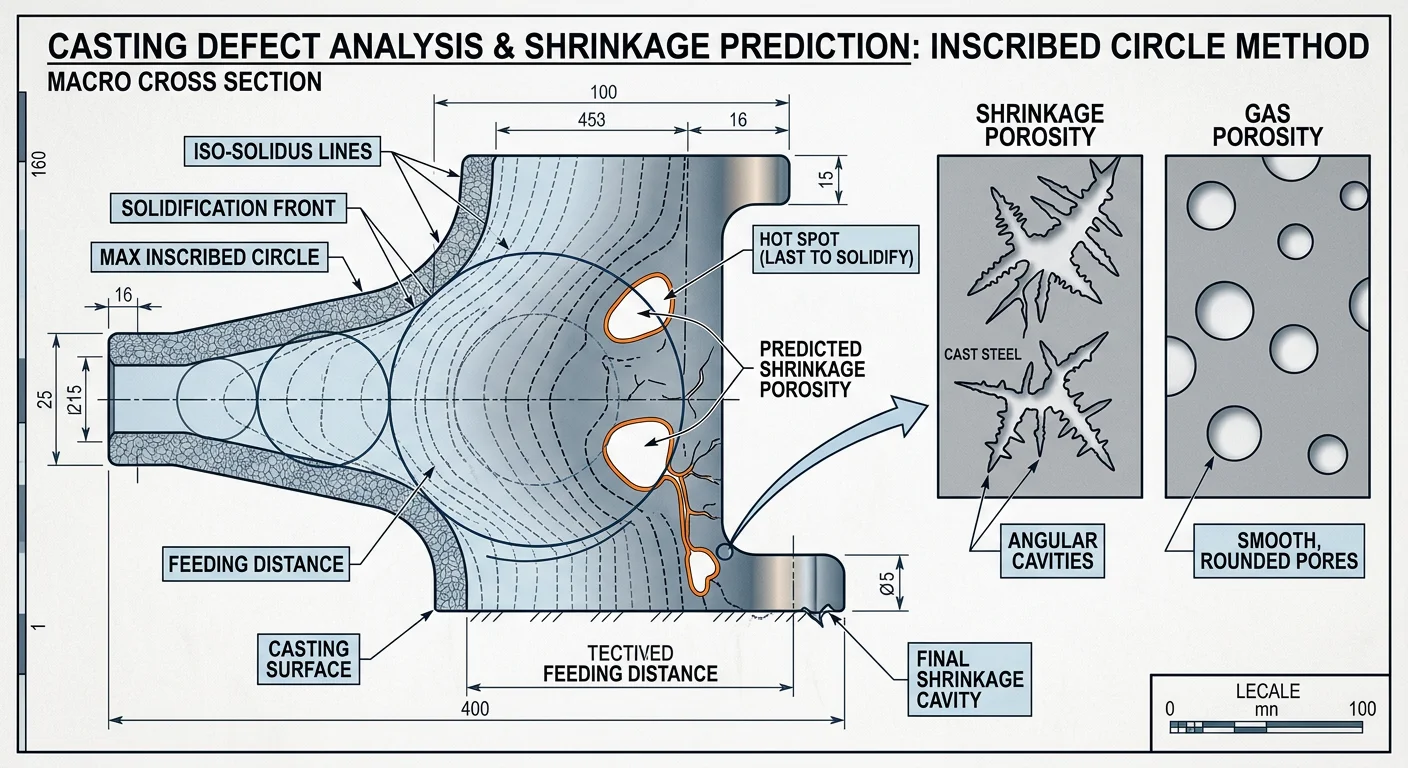
Hot spots drive it. Any section thicker than 20–50mm becomes the last area to solidify. It turns into an isolated melt pool with no feed source around it. Thinner sections nearby freeze first. That cuts the pool off. The void has nowhere else to go — it forms.
The math is punishing: thick sections more than 2–3× the adjacent wall thickness push void risk up to 5×. Engine blocks. Valve bodies. Cast iron columns. Anywhere metal mass concentrates, axial centerline porosity follows.
The inscribed circle method shows you the exact location. Draw iso-solidus lines inward. Where those lines don’t connect — that’s your shrinkage site.
Gas Porosity vs. Shrinkage Porosity: Shape & Visual Appearance
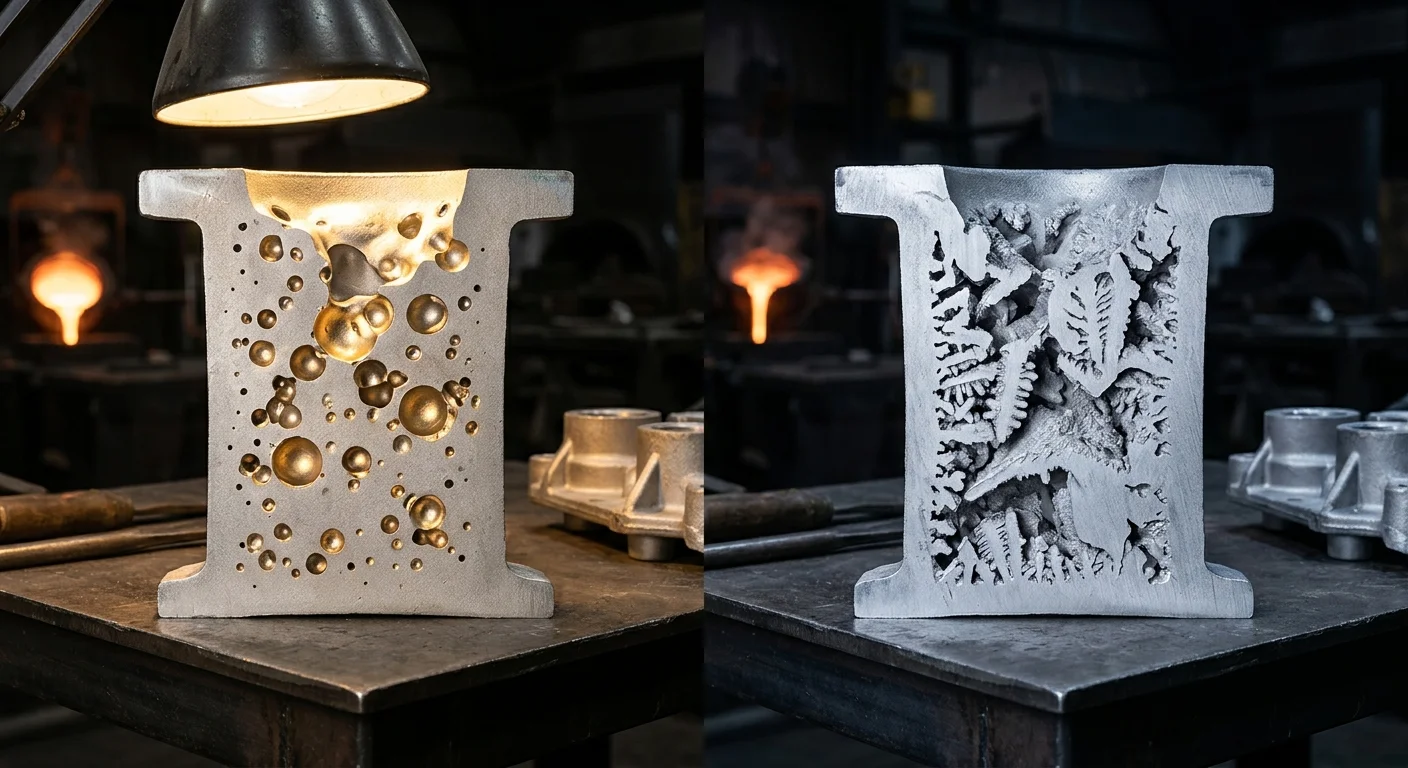
Shape is your first clue — and it’s a reliable one.
Cut a casting open and hold it under a light. The defect shape tells you almost everything before you run a single test.
Gas porosity leaves smooth, rounded voids. Think spherical, oval, or pear-shaped pockets. The walls are oxidized and catch light with a clean, glassy surface. These holes sit in isolation — scattered through the upper and mid-sections of a casting. That’s where gas tends to move before the metal solidifies around it. Under X-ray, they show up as discrete, uniform circles. Under a microscope, the walls are glassy smooth. No jagged edges. No branching.
Shrinkage porosity looks nothing like that. The edges are angular. The surfaces are rough and frost-like — sometimes called dendritic, which means they branch like ice crystals on a cold window. These cavities don’t sit alone. They link up. They spread through hot spots and thick mid-sections, forming elongated, irregular crack systems that push inward along the solidification front.
Here’s the quick visual reference:
|
Feature |
Gas Porosity |
Shrinkage Porosity |
|---|---|---|
|
Shape |
Round, spherical, oval, pear |
Angular, elongated, dendritic |
|
Surface texture |
Smooth, oxidized |
Rough, frost-like |
|
Distribution |
Isolated, scattered |
Networked, interconnected |
|
Edge character |
Soft, round edges |
Sharp, angular edges |
|
Typical location |
Upper/mid sections |
Thick sections, hot spots |
Each defect type also has sub-variants worth knowing:
-
Gas porosity variants: Pin holes (tiny surface rounds), blisters (raised thin-skin pockets), blowholes (large subsurface spheres, X-ray visible), and reaction pores (needle-shaped clusters near the surface).
-
Shrinkage porosity variants: Pipes (surface collapse extending inward), sponge (thin lattice through mid-sections), filamentary networks (crack webs in thick zones), and dendritic fractures (narrow, unconnected angular paths).
On X-ray, the difference is clear. Gas porosity shows up as clean, discrete circles. Shrinkage porosity shows up as irregular, branching networks. One is round. One is ragged. Read the shape right, and you’ve already cut the diagnostic work in half.
Gas Porosity vs. Shrinkage Porosity: Location & Distribution Pattern
Location separates these two casting defects more than almost any other factor.
Gas porosity doesn’t care where it lands. Hydrogen pores spread across the entire casting — upper sections, mid-sections, near-surface zones, deep interior. There’s no concentration logic. No predictable cluster. The gas rises, gets trapped, and stays wherever the freezing front catches it. CT scans of Al-Si die cast couplings confirm this: gas pore counts (compactness C>0.5, quasi-spherical) stay consistent across different regions of interest. Volume stays low. Leak risk stays minimal. The distribution is even — and that evenness is the tell.
Shrinkage porosity is the opposite. It’s position-specific, predictable, and punishing in the places you’d expect — hot spots, thick sections, the top of the casting where feeding runs out last. CT analysis of rejected die cast parts shows shrinkage pores (C<0.5) made up over 50% of total pore count in both measured regions. The rejected part had 104.9 mm³ more shrinkage volume in the non-accepted region versus the accepted one — a 105.8 mm³ total difference. That volume concentration triggered pressurized air leaks. Not the gas pores. The shrinkage, stacked in one zone.
The numbers set a clear threshold: shrinkage volume above 100 mm³ in a localized region predicts defect failure. Gas volume at the same level doesn’t. Same metric, different outcome — because location and concentration change everything.
Using Distribution to Predict Risk Before You Pour
Distribution patterns aren’t just diagnostic — they’re predictive. Build them into your pre-pour simulation workflow:
-
Gas porosity risk: Run a uniform full-volume scan. Flag upper, mid-section, and near-surface zones. No tight clustering expected — hydrogen spreads across the full casting volume.
-
Shrinkage porosity risk: Map hot spots and thick sections. Use Niyama criterion values below 0.1–1.0 as high-risk markers. Shrinkage follows wherever those values concentrate.
-
Subpopulation comparison: Separate pore populations by compactness (C>0.5 gas vs. C<0.5 shrinkage). Quantify volume and count per region of interest. A growing shrinkage volume gap between regions — above 100 mm³ — flags a reject before the part reaches inspection.
-
Pressure-time behavior: At 2.0 atm shrinkage pressure, porosity percentage climbs fast after just 0.06 seconds and spreads across the full domain. Gas pores stop growing once hydrogen concentration drops to saturation. Shrinkage keeps growing. Gas doesn’t.
The fix comes straight from the map: add feeders and chills at predicted shrinkage concentrations. Cut thick sections by 20–30% where volume risk exceeds 100 mm³. Adjust fill pressure to avoid the mold design changes that — in real production data — pushed shrinkage volume up by 104.9 mm³ in a single part revision.
Root Causes Compared: Why Each Type Forms
The physics behind each defect are completely different. Gas porosity is a chemistry problem. Shrinkage porosity is a geometry problem. Mix them up, and every fix you apply targets the wrong issue.
What Drives Gas Porosity
Gas porosity starts before the metal ever hits the mold. The trigger is saturation — gas concentration in the melt exceeds what the liquid can hold.
Moisture is the main culprit. Charge materials with moisture content above 0.5% cause gas to drop out of solution during the melt. Oil contamination and surface rust speed up the same reaction. They generate H₂ and CO at levels that push past 100% saturation. Once that threshold breaks, bubbles form.
Bad processing decisions make it worse:
-
Pour speed above 1.5 m/s raises gas capture rate by 30%
-
Venting channels under 5mm build back-pressure above 10 kPa — gas has nowhere to go
-
Sand moisture above 15 ml/kg expands gas volume by 20% inside the cavity
-
Melt temperatures exceeding 1550°C push gas solubility up by 25%, filling the liquid with dissolved gas that releases on cooling
What Drives Shrinkage Porosity
Shrinkage porosity has nothing to do with chemistry. It’s about volume and time. Metal contracts 3–7% during solidification. Liquid feed metal can’t always reach an isolated region fast enough to fill that gap. A void forms instead.
Four variables drive that failure:
-
Section thickness ratios above 3:1 create cooling gaps of 50°C/mm — thick zones stay liquid long after thin walls freeze shut
-
Riser volume below 1.2× the feed requirement, or riser sleeves placed more than 10mm off-center, kills feeding efficiency from the start
-
Pour pressure below 50 kPa cuts feed compensation rate by 40%
-
Asymmetric cooling rates exceeding 2°C/s difference trigger localized early solidification — sections freeze 15% earlier than the feed path can handle
The Hidden Interaction: When Both Defects Compound
Here’s what most textbooks miss: shrinkage porosity sets up the exact conditions gas porosity needs to form.
A shrinkage cavity forms. Local pressure drops below 20 kPa. That pressure drop cuts gas solubility by 30%. Dissolved gases that were stable in the melt hit supersaturation fast — then nucleate as gas pores in the same spot.
The result is a compound defect. Co-existing shrinkage and gas porosity makes up 35% of all casting defects in documented cases. The combined void ends up 15% larger than either defect would reach on its own.
The sequence goes like this:
1. Asymmetric cooling creates a shrinkage cavity
2. Local pressure drops sharply
3. Gas nucleation starts at the low-pressure site
4. A compound defect forms — larger, harder to detect, and impossible to fix by addressing just one root cause
The practical takeaway: your rejection data shows porosity clustering in thick sections near the end of fill? Don’t just add a riser. Check your melt moisture and venting at the same time. That defect may have two separate causes.
How to Detect Gas Porosity vs. Shrinkage Porosity
Detection is where diagnosis becomes real. You’ve read the shape, mapped the location, traced the root cause — now you need proof. Proof in casting defect analysis means picking the right tool for the right defect.
No single method catches everything. Visual inspection shows only what’s already on the surface. Internal porosity — gas blowholes and filamentary shrinkage buried under thick material — stays hidden until you search with the right equipment.
Match the Method to the Defect
X-ray and CT scanning are your go-to tools for internal defects. Gas blowholes invisible to the naked eye show up under radiographic testing as small, rounded shadows. Shrinkage porosity looks different — irregular, branching, darker at the edges. CT scanning takes it further. You get a full 3D picture of the internal structure without cutting the part open.
Liquid penetrant testing works well for surface-level gas porosity. Think blisters, open pinholes, and shallow pockets. It tells you nothing about what’s buried deeper.
Ultrasonic testing covers internal porosity for both defect types. It’s non-destructive, fast, and solid for production-floor screening.
Sectioning and microscopic examination gives you the final word. Cut the casting. Study the cross-section. Cavity shape, wall texture, and position confirm what other methods could only suggest.
How to Prevent Gas Porosity: Actionable Process Controls
Prevention starts with knowing which lever to pull — and pulling it before the melt hits the mold.
Gas porosity is controllable. The variables are known. The fixes are proven. What separates good foundries from struggling ones isn’t access to information — it’s execution discipline across four process stages.
In-Process Controls
Degassing is non-negotiable. Purge your melt with argon or nitrogen before every pour. For critical applications — pressure-rated components, aerospace, medical — vacuum degassing removes what inert gas purging leaves behind. Hydrogen content above 0.15 ml/100g produces visible porosity. Every time. Don’t guess at your melt quality. Measure it.
Temperature discipline matters just as much. Low pour temperatures don’t solve gas problems — they trap them. Hold the correct thermal window for your alloy. Too hot, and gas solubility climbs. Too cold, and bubbles freeze in place before they escape.
Venting and fill rate are the mechanical side of the equation. Venting channels under 5mm build back-pressure above 10 kPa. That pressure has nowhere to go, so the gas stays in your part. Shot speeds above 1.5 m/s make it worse. Control both. You cut a large share of entrapment events before they start.
Post-Process Recovery
Porosity still gets through sometimes. Two options reliably fix it:
-
Hot Isostatic Pressing (HIP) — closes gas pores in Ti-6Al-4V and reduces porosity in AlSi10Mg at temperatures as low as 350°C
-
Vacuum or pressure impregnation sealing — pushes sealant material into residual pores for leak-critical parts
The Predictive Advantage
The Gas Porosity Index is a ratio of gas bubble escape time to molten pool solidification time. It predicts porosity with 92% accuracy across SS 316, Ti-6Al-4V, Inconel 718, and AlSi10Mg. That kills trial-and-error process selection. One rollout across the iron casting industry showed scrap reduction potential of up to 7%. In automotive aluminum production, pairing better degassing with controlled cooling cut defects by 40% in engine block production.
One caution: AlSi10Mg shows gas porosity susceptibility 5–10 times higher than other common alloys. That’s your material? Tighten every control listed above. This alloy punishes loose process discipline faster than any other in the group.
How to Prevent Shrinkage Porosity: Actionable Process Controls
Shrinkage porosity is a geometry problem — and geometry has solutions.
Gas porosity is a chemistry battle. Shrinkage control is different. It comes down to three basics: feed the hot spots, guide solidification in the right direction, and don’t let isolated liquid pools die without a supply line.
Riser System Optimization
Place the riser above the thickest section. Not near it. Above it. Solidification finishes last at that point — so that’s where feed metal must arrive.
Size the riser right or don’t bother:
-
Volume ≥ 1.2–1.5× the isolated liquid volume at the hot spot
-
Modulus (volume/surface area) must exceed the casting section modulus by 20–30%
Blind risers push porosity out of heavy sections and into sacrificial zones. Design 3 — a blind riser variant — hit 38% yield equivalent to the original gating. It also wiped out porosity in mounting tabs. That’s not a small win. That’s a design fix doing what process tweaks couldn’t.
Taper feeding channels wide-to-narrow from riser to casting. Keep wall thickness at least 5mm the whole way. This geometry drives directional flow instead of chaotic fill.
Casting Structure and Process Controls
Wall thickness variation above 20% builds thermal gradients that kill feeding. Keep transitions gradual. Use inner fillets of R ≥ 3–5mm at thick-to-thin junctions. Add preformed holes into heavy sections to push porosity away from machined surfaces — anything above 2mm diameter holds up through normal process variation.
Process parameters to target:
-
Pouring height at 100–150% of mold height builds metallostatic pressure above 0.5 bar at hot spots — enough to feed shrinkage as it forms
-
Chills on isolated masses (20–50mm² contact area) speed up local solidification and cut macroshrinkage by 30–50%
-
Controlled cooling at 5–10°C/min cuts shrinkage voids by 40% in automotive block production
-
Low-resin sand (under 1.5%) or round grains (sphericity above 0.85) boosts yield 15–20% through better permeability
The Verification Loop
Simulate first. Run riser placement and modulus calculations through casting simulation software. Flag every zone where the Niyama criterion drops below 1.0 — those are your shrinkage sites before the first pour happens.
Then confirm with X-ray or ultrasonic testing. Target below 1% porosity volume. Run three to four design iterations. The winning design clears 38% yield with zero subsurface voids.
That’s the standard. Hold to it.
Impact on Casting Performance & Which Defect Matters Most
Both defects destroy performance. But they destroy different things — and that difference determines whether your part holds up in real service conditions.
Gas porosity attacks fatigue life. Cyclic loads find voids and exploit them. Each rounded pore acts as a stress concentrator. Porosity distribution data feeds into FEA simulations. Engineers use it to calculate strain-life curves and predict failure points under repeated loading. Aerospace components. Automotive suspension. Pressure-cycling hydraulics. These are the applications where gas porosity does the most damage.
Shrinkage porosity attacks structural integrity. Thick sections under restraint pull apart as the metal solidifies. Hot tears follow. Static strength drops fast. Hydraulic valve bodies and large steel castings under sustained loads — that’s where shrinkage causes the worst problems.
|
Defect |
Critical Application |
Primary Failure Mode |
|---|---|---|
|
Gas Porosity |
Fatigue/pressure-cyclic parts |
Strength reduction proportional to porosity volume |
|
Shrinkage Porosity |
Thick-section structural parts |
Hot tearing, restraint failure |
The cost stakes are real. Traditional processes run 20% defect rates. Simulation-driven optimization cuts that to 5% — a 75% scrap reduction. Process energy drops from 100 kWh to 71 kWh per run. Misread which defect you’re fighting, and those savings vanish. Get it right, and you protect both part quality and production efficiency.
Quick Reference: Gas Porosity vs. Shrinkage Porosity Comparison Table
Every diagnostic question on the shop floor comes down to one table.
|
Aspect |
Gas Porosity |
Shrinkage Porosity |
|---|---|---|
|
Cause |
Trapped air, hydrogen, poor venting, high shot speed |
Solidification shrinkage, insufficient feed metal, hot spots |
|
Shape |
Round, spherical, smooth walls |
Irregular, angular, dendritic, rough walls |
|
Location |
Upper casting, last-fill zones, areas with weak venting |
Thick sections, hot spots, centerlines, rib junctions |
|
Detection |
X-ray shows clean circles. Inner surface is smooth. |
X-ray shows branching networks. Interior is rough, frost-like. |
|
Prevention |
Improve venting, control temp and shot speed, purify melt |
Add risers, control cooling rate, redesign thick sections |
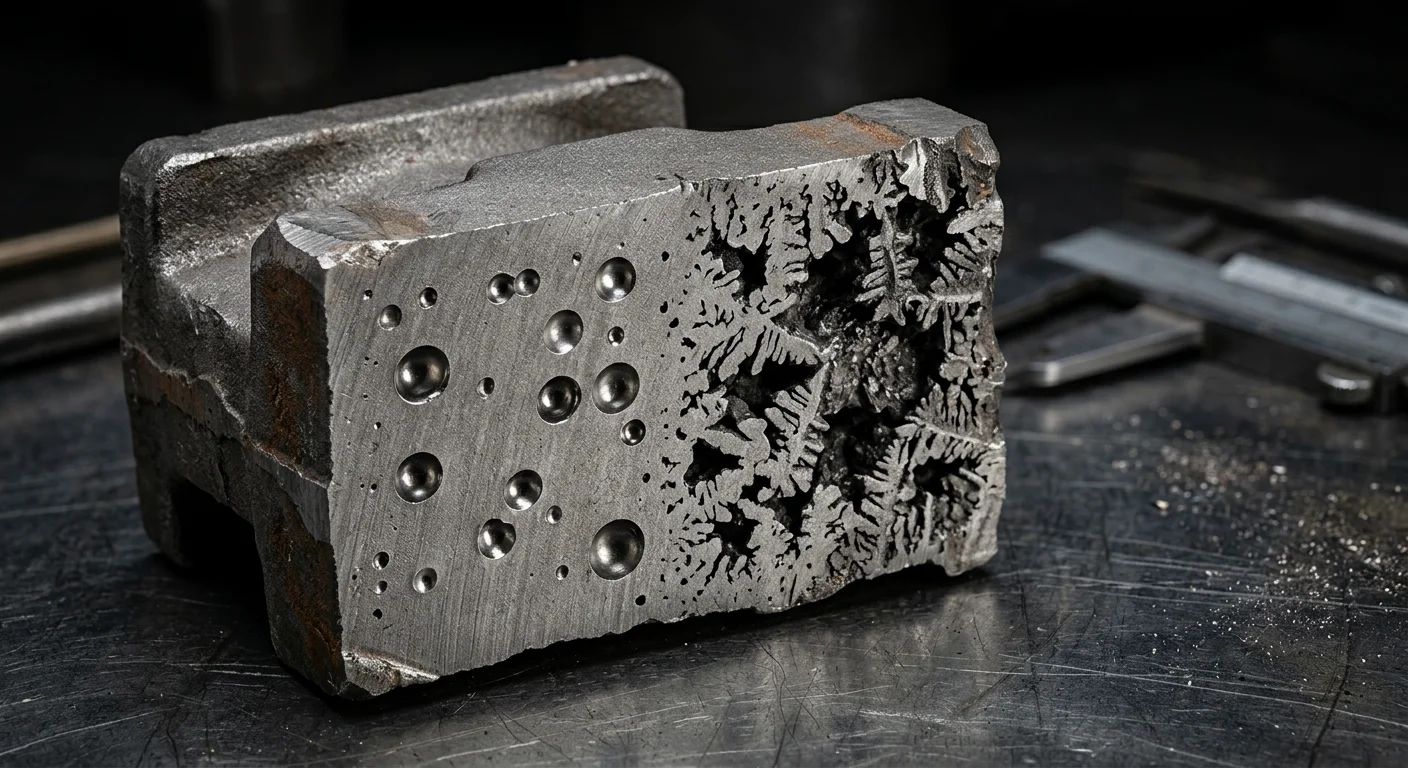
One rule cuts through everything: section the part and look at the wall.
-
Smooth interior = gas.
-
Rough or dendritic = shrinkage.
That single observation cuts out half the diagnostic work. You don’t need any equipment running to get there.
Both defects damage pressure tightness and structural strength. They also show up together in the same casting far more often than most engineers expect.
Conclusion
Porosity doesn’t have to be a mystery. It just needs the right lens.
Gas porosity comes from trapped gases escaping a solidifying melt. Shrinkage porosity is a feeding problem — driven by volumetric contraction. Once you see the difference, prevention stops being guesswork. It becomes engineering.
The shape tells a story. The location tells another. Together, they point straight to the fix.
Auditing a rejected batch? Designing a new gating system from scratch? The real differentiator isn’t just knowing what type of porosity you’re dealing with. It’s knowing why it formed — and where in the process it went wrong.
So here’s your next move: take the comparison table and walk it back through your last defect report. See which pattern matches. The answer is closer than you think.
Better castings don’t come from luck. They come from understanding the difference.