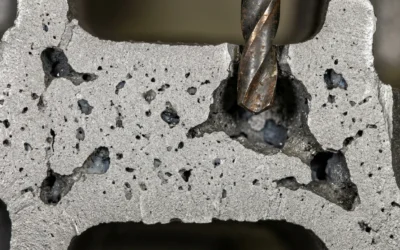
Shrinkage defects don’t announce themselves until the damage is done — buried inside a casting that looked fine coming out of the mold. For foundry engineers and production managers, that moment of discovery is expensive, frustrating, and almost always preventable.
The real problem isn’t the defect itself. It’s not knowing which lever to pull to stop it from happening again.
Fixing shrinkage defects in Ductile Iron castings starts with a handful of controllable variables:
-
Riser design
-
Solidification direction
-
Melt chemistry
-
And a few more
Each one matters. Knowing how to combine them for your specific production conditions is what separates a clean casting from a scrapped one.
This guide breaks down five proven methods. There’s enough technical depth here to be genuinely useful — not just surface-level theory.
Why Ductile Iron Castings Are Prone to Shrinkage Defects (Root Cause Analysis)
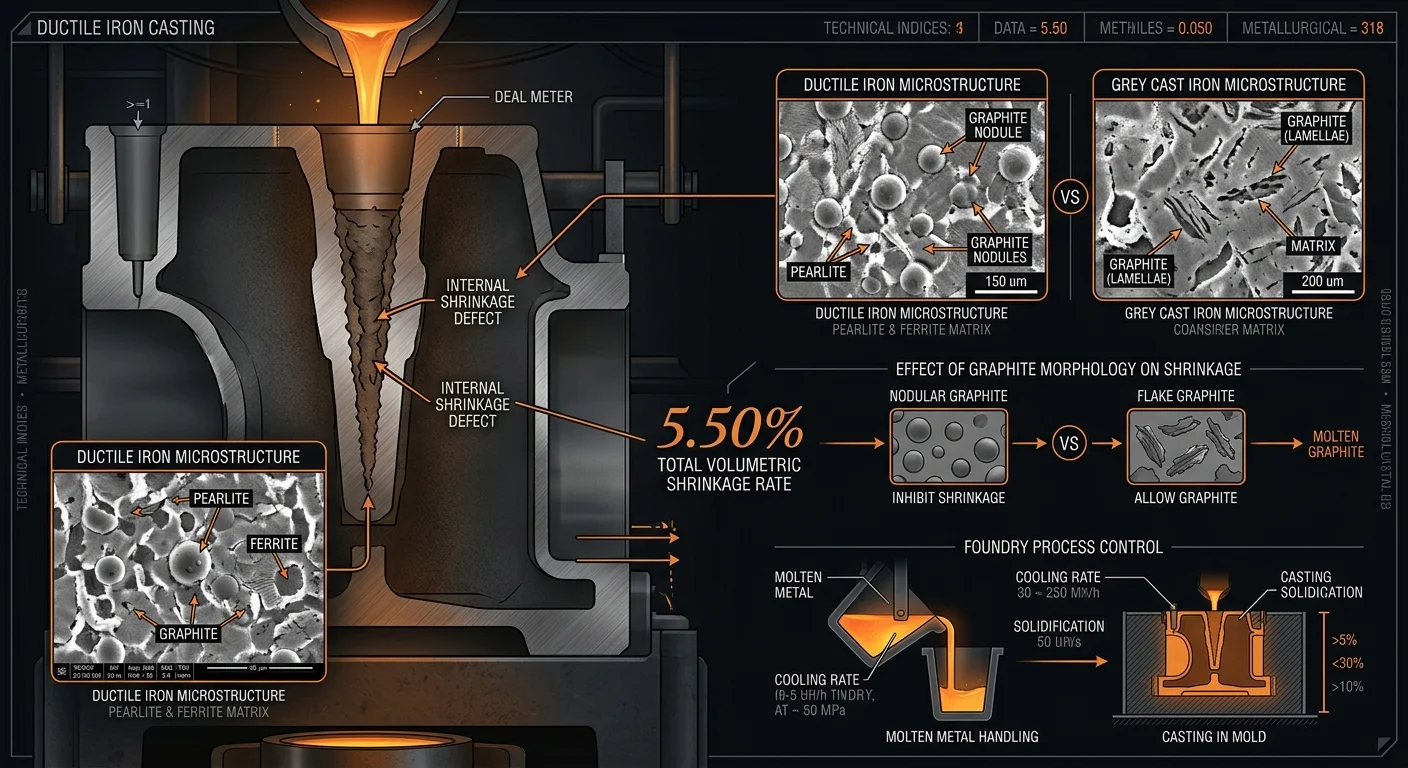
Ductile iron has a shrinkage rate of 5.50% — that’s 3.4× higher than grey cast iron at 1.65%. That single number explains a lot.
The material contracts hard during solidification. Liquid volume shrinkage runs 4–7% in iron alloys. That contraction has to go somewhere. Where it ends up depends on which area of the casting solidifies last.
Two Categories, Equal Blame
The data is clear: 50% of shrinkage defects trace back to sand systems, feeding and gating. The other 50% are metallurgical — carbon equivalent, pouring temperature, inoculation quality, and residual magnesium levels.
Neither category dominates. Both contribute at the same level. Poor management of one makes the other worse.
A few specific metallurgical triggers worth knowing:
-
Mg residuals above 0.05% increase shrinkage tendency. Keep Mg in the 0.035–0.04% range — that range cuts risk in a real, measurable way
-
Low carbon equivalent or poor inoculation limits graphite expansion during solidification. That expansion is what offsets liquid contraction. Without it, shrinkage gets worse
-
High pouring temperatures increase liquid shrinkage volume before solidification even starts
Geometry Makes It Worse
Thick sections cool slowly. Thin sections cool fast. A temperature gradient above 85°C between them causes isolated liquid pockets to form in the thick zones. Those pockets get cut off from feeding. The metal has nowhere to go.
The outcome is predictable: macroshrinkage voids appear in the center of heavy sections. Microshrinkage porosity forms along dendritic boundaries. One study on automobile SG 500/7 body castings recorded an 18.7% defect rate in machined areas — traced directly to uneven section thickness.
The geometry won’t change. The process has to compensate for it.
Method 1: Optimize Riser and Feeding System Design
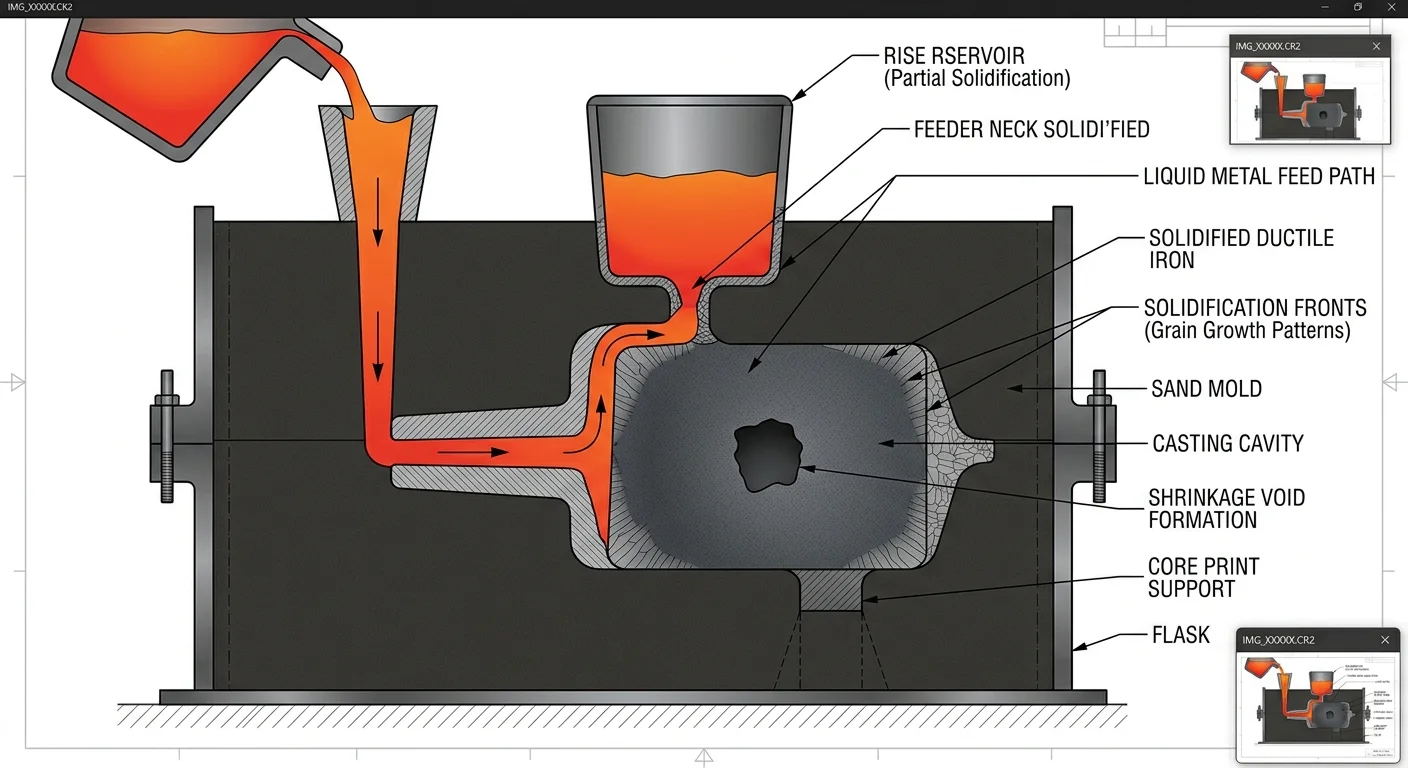
The riser is not decoration. It’s a liquid metal reservoir — built to feed shrinking metal back into the casting as it solidifies. Get it wrong, and you’ve built a void right into your part.
The core rule is simple: the riser must solidify after the casting, not before it. That order is fixed. The governing formula is the modulus relationship:
M_r ≥ 1.2 × M_c
Where M_r is the riser modulus and M_c is the casting section modulus. That 1.2 multiplier has a reason — it corrects for the gap between modulus and actual freezing time. Drop below it, and your riser freezes too soon. The feed path closes off. A void forms right where you least want one.
Four Rules That Hold Up in Practice
Riser design comes down to four hard criteria:
-
The feed channel stays open until the casting finishes solidifying — minimum neck diameter comes from a cubic equation, not a guess
-
The riser solidifies last — governed by Chvorinov’s rule: t_s = C(V/A)²
-
Stored volume covers the demand: V_r ≥ shrinkage volume ÷ feeding efficiency
-
Neck height exceeds 15 mm — shorter necks freeze off too soon
High-Performance Feeder Sleeves Change the Math
Standard sand risers waste a lot. High-performance feeder sleeves — such as Chemex Tele-Feeders — deliver 20–50% of their total volume as usable feed metal. A 10 in³ riser gives you 2–5 in³ of real compensation. That’s a real difference in yield.
Simulation data backs this up. Tele-Feeder designs produce the smallest riser footprint with the best feeding efficiency — better than sand or slurry alternatives.
A practical sizing reference:
|
Parameter |
Guideline |
Example |
|---|---|---|
|
Modulus |
M_r ≥ 1.2 M_c |
M_c = 40 mm → M_r ≥ 48 mm |
|
Volume efficiency |
20–50% delivery |
10 in³ riser → 2–5 in³ fed |
|
Neck height |
h > 15 mm |
Tele 500-40(60) |
|
Gating ratio |
1:2:4 (sprue:runner:ingate) |
Optimized via NSGA-II |
Where Designs Break Down
Three failure patterns show up across foundries:
-
Undersized riser volume — can’t meet casting demand, voids form
-
Modulus below 1.2× — riser freezes before the casting, feed path collapses
-
Poor riser placement — hot spots go unfed even when volume looks sufficient
That last one is easy to miss. A side riser placed too low never gets hot metal. It freezes fast. The hot spot it was meant to feed stays liquid, sits isolated, and collapses inward.
Systems validated at 710°C pour temperature with 4.5-second fill times show intact castings with clean contours and clear yield gains. You get fewer returns, less riser removal waste, and higher throughput per cycle.
Method 2: Redesign Gating System for Directional Solidification
Most gating systems don’t fail in a dramatic, obvious way. They fail through turbulence numbers that creep past a threshold nobody caught during design review.
Here’s the number to keep in mind: 4.08 m/s. Above that velocity, turbulent flow pulls secondary oxidation, air entrapment, and inclusions into your melt. A bad gating setup crosses that line on a regular basis. One documented design hit a peak velocity of 5.1 m/s at the sprue bottom — deep into the red zone. Simulation shows it in plain terms: red.
The fix wasn’t dramatic. It was systematic.
Gating Ratio: The Number That Controls Everything Upstream
Change the gating ratio from 2:1.75:1.5 to 1:2:1.5 (sprue:runner:ingate). This expands the ingate area relative to the sprue. Metal slows down before it reaches the mold cavity. All velocities fall below 4.08 m/s. Red zones clear up. Flow turns uniform, erosion drops, and isolated liquid pockets stop forming at runner branches.
Two ingates become four. Yield climbs to 76.58%.
Directional Solidification Through Riser and Chill Redesign
Riser necks with sharp geometry create bottlenecks. Switch from a chamfered neck to a curved transition profile — sized using Caine’s curve optimization. This keeps the feed path open longer and cuts out the flanging porosity that sharp geometry causes.
A feeder alone sometimes isn’t enough. In those cases, embed a chill into the thick-wall section. Chills pull heat from the heaviest geometry first. Solidification then moves back toward the riser — right where feed metal sits and is ready to use. Target ΔT below 45°C between sections.
Simulation checks every design pass before production starts. Autocast-X data shows that catching problems at the design stage stops yield losses above 20% — losses that would otherwise show up as production rework. Fix it in CAD. Not on the floor.
Method 3: Control Chemical Composition with the SPI Index
Chemistry is the variable most foundry engineers underestimate. They realize this too late — staring at a sectioned casting full of porosity, with no good explanation left.
The SPI (Shrinkage Prediction Index) gives you a number before that happens. The formula focuses on the elements that drive graphite expansion during solidification. That expansion offsets liquid contraction. It’s what separates a clean casting from a scrapped one.
The formula looks like this:
SPI = (Cu + 0.5Cr) / Si × 100
Keep that value below 35. Cross it, and the balance between carbide-promoting elements and silicon shifts the wrong way. Graphite expansion drops. Shrinkage tendency rises.
Why These Three Elements
Each variable in the SPI formula has a specific role:
-
Silicon promotes graphite formation during eutectic solidification. Higher Si content boosts graphite expansion — the force that pushes back against liquid contraction. It’s your main tool for shrinkage control.
-
Copper increases hardness and hardenability. At higher levels, though, it suppresses graphite expansion. That’s why it sits in the numerator — it works against you above certain concentrations.
-
Chromium is a strong carbide stabilizer. Even small amounts reduce graphite formation. The 0.5 weighting reflects this — it carries half the influence per unit compared to copper, but the effect is still real.
Keeping the Full System in Balance
The SPI index doesn’t work alone. It connects with carbon equivalent (CE), residual magnesium, and inoculation quality:
-
CE range: target 4.3–4.6% — low CE cuts graphite nucleation sites, which weakens expansion
-
Residual Mg: hold between 0.035–0.04% — above 0.05%, shrinkage tendency goes up in a measurable way
-
Inoculation quality: poor inoculation kills graphite expansion, no matter how well your SPI value is tuned
Track all four. Focusing on one and ignoring the rest is exactly how a well-calibrated SPI still produces defective castings.
The index gives you a target. Consistent process control is what gets you there.
Method 4: Use Casting Simulation Software to Predict and Eliminate Shrinkage Zones
Simulation software doesn’t guess. It shows you — in color-coded detail — where your casting will fail before a single gram of iron gets poured.
Tools like PoligonSoft and ProCAST map shrinkage porosity using temperature gradients and volumetric porosity fractions. That’s not theory. In documented cases with rectangular and cylindrical steel castings (14X17N2L), local zones hit 40–50% porosity concentration in specific areas — while the body averaged 5–10%. Those numbers line up with real defect locations confirmed after casting.
What These Models Do Differently
Standard porosity models tend to overpredict. They flag defect zones that are bigger than what forms in practice. The newer PoligonSoft model fixes this. It separates closed shrinkage cavities from macropores, and its output matches sectioned castings far better than older approaches.
ProCAST adds something else: a precise prediction of solidified metal layer thickness. That matters because the layer geometry controls where isolated liquid pockets form — and how long they stay liquid.
The InteCast model goes further. It runs a mushy zone pressure drop calculation using a calibrated coefficient — C_T = 47.5 μm/(°C/s)^{-1/3} — pulled from dendrite arm spacing data. It uses hydraulic isolation logic to place defects with real precision. In one benchmark, it predicted porosity above 0.4% in 20mm thick sections with 87% accuracy against X-ray CT results. Standard models put the cavity at the riser top. The defect was in the thermal center. That gap is the difference between a tool that helps and one that misleads.
The Workflow That Makes It Useful
Simulation pays off only when connected to action:
-
Input casting geometry and run the porosity model
-
Find hot spots and high-porosity zones (40–50% flags need immediate attention)
-
Adjust riser and feeder placement based on output
-
Check results against CT or X-ray data from physical trials
-
Refine material coefficients and repeat
FLOW-3D CAST keeps solidification temperature error below 5%. That level of precision puts the simulation close enough to reality to support real design decisions — not rough estimates.
The practical result: fewer physical trial runs, lower scrap rates, and defects caught in CAD rather than in the machining room.
Method 5: Apply Ceramic Foam Filters and Advanced Melt Treatment
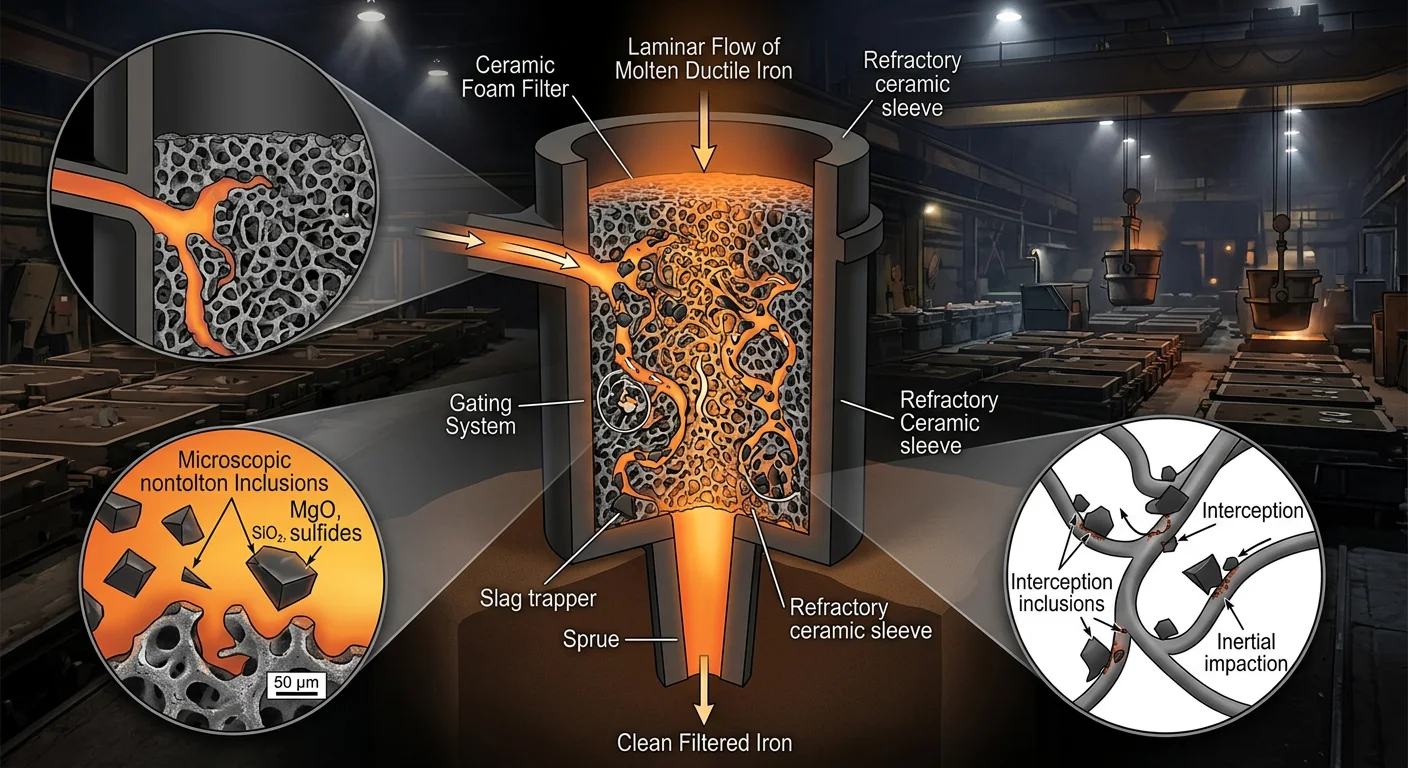
Inclusions don’t care how well you’ve optimized everything else. One turbulent pour, one pocket of trapped oxide — the casting is compromised. That’s true even if your SPI index was perfect and your riser modulus was textbook.
ceramic foam filters fix this at the source. They sit inside the Gating System and do three things: block particles by physical interception, slow the melt into laminar flow, and let inclusions float out before they reach the cavity.
How the Filtration Works
The foam structure captures inclusions larger than its pore size at the inlet face. Those particles build up into a filter cake layer. That layer narrows the flow channels further, so filtration actually improves as the pour goes on.
At the same time, the porous network breaks the melt into smaller streams. Reynolds number drops. Flow turns laminar. At that point, denser molten iron separates from lighter inclusions on its own — inclusions rise, collect on runner surfaces, and stay out of your casting.
Specifications That Matter
Getting the filter wrong is easy. These parameters decide whether it works or fails:
|
Parameter |
Range/Target |
Why It Matters |
|---|---|---|
|
Foam cell count |
10–60 ppi |
Controls pore size and head loss |
|
Slurry solids content |
60–85 wt% |
Sets wall thickness |
|
Drying temperature |
80–120°C |
Prevents cracking during drying |
|
Burnout ramp |
0.5–2°C/min to 350–700°C |
Prevents blowouts |
|
Sintering temperature (Al₂O₃) |
1100–1600°C |
Determines ceramic bridge strength |
Moisture content after drying must fall below 1.0%. For larger filter specs, you need active control of both temperature and humidity during drying. Uneven conditions cause deformation and cracking — before the filter ever touches molten metal.
Sintering matters more than most engineers expect. Skip enough of it and you’re left with weak ceramic bridges. That leads to “filter dusting” — ceramic particles releasing into the melt, swapping one contamination problem for another.
The Hollow-Strut Problem and How to Fix It
Standard replica-method filters carry a structural weakness. The polymeric sponge burns out during firing. Thermal expansion differences between the sponge and the ceramic coating create micro-cracks inside the struts. The struts end up hollow. Strength drops. Friability goes up.
Vacuum infiltration after burnout fixes this:
-
Heat to 600°C over 1 hour at a ramp of 1°C/min — this burns out the sponge without residue
-
Vacuum infiltrate with Al₂O₃/SiO₂ ceramic suspensions at 15–40 wt% solids
-
Follow with colloidal silica infiltration at 40 wt% solids for 1 minute — this step gives the best results
The nano-particles fill the voids inside the struts. Struts get denser and thinner. Friability drops. Permeability stays high. Thermal shock resistance goes up too — silica’s low thermal expansion coefficient and low Young’s modulus absorb the stress that cracks conventional filters.
Validation Before Full Production
Don’t skip the trial run. Run metallographic analysis or PoDFA/LiMCA testing on small-scale pours. Count how much inclusion reduction you’re getting. The numbers don’t move? Adjust pore size or recheck sintering conditions before you scale up.
Material selection ties back to your pour temperature. Match the filter to the alloy’s melting point. An undersized thermal rating means the filter breaks down mid-pour — and all the inclusion control you built into the system is gone at exactly the wrong moment.
How to Diagnose Existing Shrinkage Defects Before Applying Fixes

Before you adjust a single process variable, know what you’re dealing with. Foundries waste entire production runs by guessing at root cause from a scrapped casting. They pick the wrong fix and run it again.
The diagnostic step isn’t optional. Everything else starts here.
Use Real-Time Cooling Data to Catch Risk Early
NDT tells you what happened. Thermocouple monitoring tells you what’s about to happen.
Place thermocouples in the mold and riser. Track dT/dt — the rate of temperature change during solidification. Two signals matter:
-
A dT/dt drop exceeding 2°C/min means feeding is insufficient. It flags shrinkage onset.
-
A plateau below 1°C/min points to active cavity formation in heavy sections.
In one SG iron automotive casting case, Pareto analysis showed 80% of defects came from cope volume exceeding riser feed capacity. The team adjusted feed parameters using dT/dt data. Shrinkage risk dropped to zero.
Cut metallographic sections from representative samples to confirm NDT findings. Prep the surface, calibrate UT at 2–5 MHz, and scan from multiple directions. The goal is a documented defect profile — size, location, severity — before you change a single process setting.
Choosing the Right Combination of Methods for Your Production Scenario
Five methods on the table. The question isn’t which one works — they all do, under the right conditions. The real question is which combination fits your casting geometry, your batch scale, and your current failure pattern.
Start with your diagnostic data. That’s not a suggestion. Run RT or UT on your scrapped castings first. Without that, you don’t know if you’re solving a feeding problem, a chemistry problem, or a flow problem. Each one points to a different fix.
Match the method to the root cause:
-
Shrinkage concentrated in heavy sections → Riser redesign (Method 1) paired with simulation validation (Method 4)
-
Porosity scattered through thin walls or runner junctions → Start with gating ratio correction (Method 2), then deploy filters (Method 5)
-
Defects tied to batch chemistry variation → Lock in SPI index monitoring (Method 3) before changing anything else
-
Multiple defect types across the same casting → Use Simulation (Method 4) to rank priorities, then apply the relevant process fixes
Don’t stack all five methods at once. You’ll lose track of what’s moving the needle.
Pick the two methods most tied to your diagnosed root cause. Run them. Measure scrap rate against your baseline. Add a third method only if data shows residual risk. Controlled sequencing beats a costly full overhaul every time.
Conclusion
Shrinkage defects don’t happen by chance — they follow patterns. And patterns can be controlled.
The five methods covered here give you a complete toolkit: riser design, directional solidification, SPI index precision, simulation software, and advanced melt treatment. No single fix works alone. The foundries that produce clean Ductile Iron castings are the ones that stack these strategies with purpose. They diagnose before they act. They treat every production scenario as its own engineering problem.
That’s the real takeaway — shrinkage is a systems problem, not a settings problem.
Ready to put this into practice? Start with a simulation run on your most problematic casting geometry. Let the data show you where your current process is falling short. Then work backward through the methods to close the gaps.
Knowing how to avoid shrinkage defects in ductile iron castings gets you halfway there. The other half is doing it — step by step, run by run, with no shortcuts.