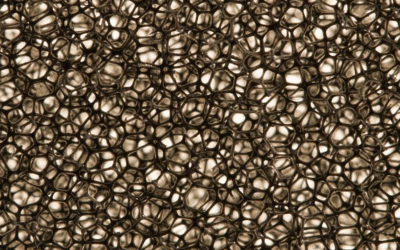
Is Ceramic Foam Porous?
Yes, ceramic foam is porous. Porosity defines what ceramic foam is. It shows the percentage of void space (cavities) compared to the total volume of the material. Without porosity, you wouldn’t have foam.
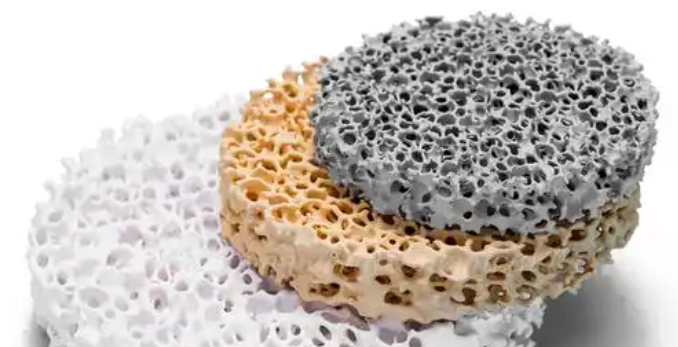
Porosity levels vary widely. The ceramic type and how you make it determine the porosity:
-
SiC porous ceramics: 45.85–56.32% porosity
-
Al₂O₃ porous ceramics: 11.2–38.82% open porosity
-
Al₂O₃ ceramic foams: 86.2–91.0% porosity
These numbers come from research data. Research shows that optimal SiC ceramic foam achieves 56.32% porosity. This happens with 5 wt.% H₂O₂ addition at 85°C foaming temperature.
Understanding Pore Structure
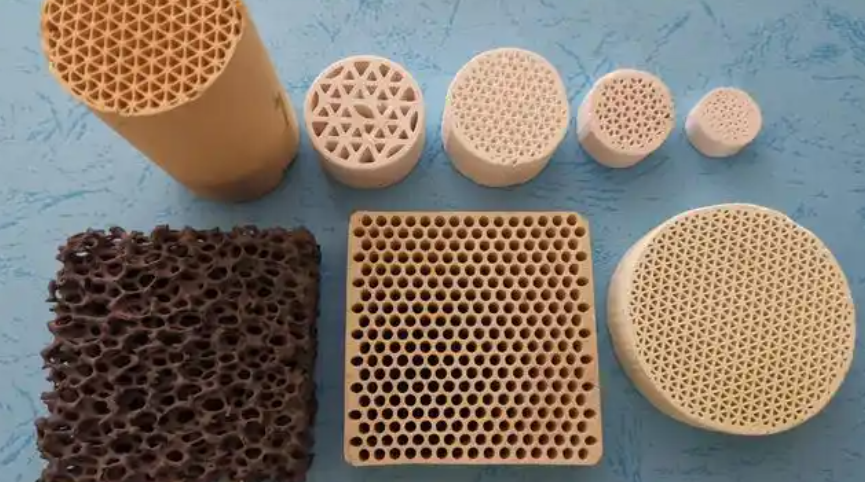
The pores measure 150–240 μm in average diameter. They maintain a near-spherical shape. Industry uses “pores per inch” (PPI) to classify foam density:
-
10 PPI: 7–13 holes per 25.4mm
-
20 PPI: 17–23 holes per 25.4mm
-
30 PPI: 27–33 holes per 25.4mm
-
60 PPI: 57–63 holes per 25.4mm
The bulk density ranges from 2.71–2.8301 g/cm³ . Higher porosity means lower density. They have an inverse relationship. For industrial filtration, you need porosity ≥84% . This ensures good filtration rates and capacity per unit volume.
Porosity Definition and Measurement
Porosity measures the empty space inside ceramic foam. We express it as a percentage of total material volume. Two types exist: total porosity (all pores, both connected and isolated) and effective porosity (interconnected pores that let fluid pass through). This difference matters. Effective porosity tells you the actual filtration performance.
Laboratory Measurement Techniques
Boyle’s Law Method uses helium gas expansion to find effective porosity. Helium enters tiny pores without causing chemical reactions. The technique uses the principle P₁V₁ = P₂V₂ to find solid volume and apparent density. This method doesn’t damage samples. You can test them again later.
Fluid displacement fills samples under vacuum conditions. You subtract leftover fluid volume from total fluid volume. This gives you the pore space. The method works best for ceramic materials that mix well with water.
Mercury intrusion porosimetry pushes mercury into pore structures under controlled pressure. The Washburn equation turns pressure readings into pore diameter measurements. This technique covers a wide range: 4 nanometers to 900 microns. Professionals use it to analyze mesopores and macropores (4 nm to 60 μm diameter).
Advanced Characterization Methods
Gas sorption (BET method) measures how gases stick to surfaces. It uses nitrogen at 77 K or argon at 87 K. Tools track gas uptake to find surface area and pore distribution. The pore-size range depends on gas molecule size and equipment quality.
Scanning electron microscopy (SEM) shows surface details at nanometer scale. Pair it with focused ion beam technology (FIB-SEM). You can cut into internal layers for cross-section views.
Computed tomography (CT scanning) creates 3D models. These show external shape and internal empty spaces. Software reviews these digital images to spot defects and check structure consistency.
Resonance frequency testing checks samples without damage. Sensors measure vibration response from controlled tapping. Different frequencies between samples show different porosity levels. This fast method cuts testing costs and keeps products intact.
Standard lab samples measure 2 inches in diameter and 1-3 inches in length. You need caliper measurements of both dimensions for exact volume calculation.
Types of Pore Structure
Ceramic foam has several pore types. Each type does a different job in industrial use. We group pores by size, location, and how they connect.
Classification by Pore Size
Ceramic foam has three main pore sizes:
-
Micropores: Less than 2 nm wide
-
Mesopores: 2–50 nm wide
-
Macropores: Greater than 50 nm wide
This standard works for most ceramics. But special materials use different scales. Mudrock-based ceramics measure differently: micropores are 1–62.5 μm, mesopores are 62.5 μm to 4 mm, and macropores are over 4 mm.
Mesopores and macropores do most of the filtering work. They form the main paths for fluids. Micropores change based on the rock type and how you make the ceramic.
Classification by Pore Location
Where pores sit in the material affects strength and heat resistance:
Interparticle (InterP) pores sit between grains and crystals. Sintering creates these natural gaps. They form the main flow paths.
Intraparticle (IntraP) pores sit inside mineral particles. They form when the material doesn’t fully densify or when you add foaming agents. Research shows several types: intercrystalline pores, dissolution pores, and wedge-shaped pores at clay edges.
Organic Matter (OM) pores fill spaces in organic compounds. You find them in bio-ceramic mixes and carbon-ceramic blends.
Fracture pores cut through the matrix and grain edges. Engineers put them in a separate group. They form from stress, not from the material itself.
Advanced ceramics show complex shapes. Face-edge mineral contacts create angular spaces. Folded clay sheets form crescent-shaped pores (100 nm–1 mm range). Clay sheets also create long, narrow pores less than 100 nm.
Classification by Connectivity
How pores connect controls real-world performance:
Open pores connect through the whole structure. Fluids and gases move through them freely. This makes ceramic foam work well for filtering and catalysis.
Blind pores open at one end. Fluids enter but can’t pass through. They lower the working porosity.
Isolated pores have no outside access. They add to total porosity but don’t help with filtering.
Interconnected pores let particles flow from surface to center. Research shows that pore connections affect how liquids pass through and wet the surface. Disconnected pores lower working porosity even when total porosity is high.
Mixed Pore Networks in Real Materials
Industrial ceramic foam has mixed pore types. Tests on Barnett Shale, Bossier Shale, and Pearsall Formation used point counting (2000 points each). The results showed mixed networks with no single pore type in charge.
Most ceramic foams have slit-like or narrow slit-shaped pores. Surface area ranges from 0.026 to 1.282 m² using the Brunauer–Emmett–Teller method. The best rock types (LF1-LF3) have strong pore structures with good pore volume for fluid flow. These materials have brittle minerals and total organic carbon (TOC) over 3 wt%.
Typical Porosity Ranges
Porosity values shift greatly across different materials and structures. General soil materials show 0.30–0.70 porosity. This wide range comes from natural differences in how particles arrange themselves and what they’re made of.
Granular and Geological Materials
Polydisperse sands keep tighter porosity controls at 0.30–0.35. Uniform particle sizes pack well with little void space. Fluvial sand-gravel deposits vary much more: 0.06–0.48. River flow and sediment mixing create this range.
Processed mineral materials show steady patterns:
-
Crushed quartzite: 0.37–0.42
-
River gravel: 0.38–0.39
-
Marble chips: 0.38
-
Sand: 0.37–0.43
These materials group around 0.38 average porosity. The tight ranges show manufacturing stays consistent.
Advanced Nanostructured Materials
Carbon nanotube films reach high porosity levels. Isotropic fiber orientation creates 0.7–0.9 porosity. The random setup leaves maximum void space. Oriented carbon nanotube networks drop to 0.3 porosity. Aligned fibers pack tighter. Standard carbon nanotube structures measure 0.73 porosity.
Silk fibroin electrospun networks achieve 0.76 porosity. General nanofiber materials range 0.7–0.9. These high values make them great for filtration and catalysis.
Factors Controlling Porosity
Particle size affects porosity. Larger particles boost both hydraulic conductivity and void space. At fixed network mass and porosity, bigger fiber diameters create larger pore radii.
Particle shape plays a big role. Irregular shapes leave bigger gaps between surfaces than spherical or regular particles do. The diameter ratio (Dp/dg) influences final porosity across a 5.08–254 range. This ratio controls how smaller particles fill spaces between larger ones.
Pore Size Characteristics
Ceramic foam pores range from nanometers to millimeters. You need different measurement methods to capture this full range. Each method covers specific sizes. Manufacturers rely on this data to control product quality.
Measurement Methods and Their Ranges
Gas adsorption finds the smallest pores—from 0.35 nm to over 100 nm. Labs use nitrogen at -196.15°C or CO₂ at 0°C. This works best for surface pores smaller than 200 nm. The method shows where gas sticks to internal surfaces. This reveals nano-scale details.
Mercury intrusion porosimetry (MICP) covers a wider range: 3.2 nm to over 400 μm. Most applications focus on the 10 nm to 1000 μm range. MICP works at room temperature. It pushes non-wetting mercury into pores under pressure. You get pore-throat distribution data. This shows how pores connect through the structure.
Capillary flow porometry (CFP) measures through-pores (pores that let fluid pass). Standard CFP equipment handles 13 nm to over 500 μm. Advanced versions go further:
-
Innova Capillary Flow: 0.013 μm to 500 μm
-
Innova Ultra Nano: 0.002 μm to 500 μm
-
Innova Liquid-Liquid: 0.002 μm to 0.2 μm
CFP gives you three key numbers: bubble point (largest pore size), mean flow pore diameter, and complete pore size distribution.
Small-angle neutron scattering (SANS) checks pores ≤100 nm without damaging samples. It measures both connected and isolated pores at once. SANS gives high accuracy for nano-scale work that other methods can’t match.
Combined Measurement Approaches
Industry standards call for combining methods. This fills measurement gaps. SANS paired with MICP gives you a complete picture. SANS handles pores ≤100 nm. MICP covers from 3.4 nm to larger pores. This pairing avoids sample damage. Plus, it gives full-scale data across all pore sizes.
Shale samples need a multi-method approach. CO₂ adsorption works for pores <2 nm. N₂ adsorption covers 2–200 nm pores. SANS checks pores ≤100 nm. MICP measures pores >100 nm.
Impact of Porosity on Material Properties
Porosity controls how ceramic foam performs in real uses. The void space percentage changes mechanical strength, thermal behavior, and what the material can do. Engineers balance these factors during material selection for specific tasks.
Mechanical Property Changes
Young’s modulus drops as porosity rises. Porous Ti6Al4V alloy shows this effect well. The modulus ranges from 7 to 60 GPa based on void space amount. Materials with 23-32 vol% porosity match human cortical bone’s modulus. This makes them perfect for medical implants that integrate with natural bone tissue.
Strength works the same way. Laser-processed porous Ti6Al4V structures show 0.2% proof strength from 471 to 809 MPa. This depends on porosity levels and how you make them. More porosity means less strength. But biological performance gets better.
Wall thickness matters a lot. Remove even small amounts of cell walls. Properties drop fast. Lower porosity makes this worse. Wall thickness changes hit 2D foams hard. Thin walls create weak spots. These spots hurt the whole structure.
Structural Variables That Drive Performance
Pore shape irregularity works differently at different porosity levels. At low porosity, odd pore shapes do little to mechanical properties. The solid material handles most loads. At high porosity, pore shape still has little impact. Network geometry runs the show.
Pore distribution uniformity gives odd results. How you place pores at first barely affects final properties. The representative volume element (RVE) averages out local changes. Tests prove this after reaching 9 pores in the RVE. Results then repeat and stay steady.
Anisotropy shifts with pore count and porosity. More pores make the material more uniform in all directions. But more porosity creates bigger directional differences. Build direction in additive manufacturing makes more pore connections up and down than side to side. This holds until density drops below 75%. Then connections become uniform in both directions.
Manufacturing Control of Properties
Process settings control porosity and performance:
-
Scan speed increase: Makes high porosity
-
Laser power decrease: Boosts porosity levels
-
Hatch distance increase: Creates very porous parts
Bulk density of laser-processed samples sits at 67-85% of theoretical density. Set combinations of scan speeds (10-25 mm/s), powder feed rates (15-35 g/min), and track distance (0.762-1.27 mm) give you exact pore sizes and patterns.
Functional Benefits of Controlled Porosity
Proper porosity boosts biological integration. Tests on porous Ti6Al4V implants in rats ran 16 weeks. Large calcium deposits formed inside the material. Living tissue grew through connected pores. Total porosity volume sets how well this works. More connected void space gives better tissue growth.
Porosity helps lubrication. More porosity holds more fluid. Surfaces slide better against each other under load. The ceramic foam stores fluid. It releases lubricant during use.
Predictive Models for Design
Engineers use several models to predict porosity effects on properties:
Mori-Tanaka Model finds mechanical properties from pore slenderness ratio. It works well for materials with long pores.
Three-Phase Model (TPM) gets effective shear modulus from porosity data. It views the material as three parts: solid phase, pore phase, and interface.
Voronoi Tessellation Method builds 3D random porous models. You put in porosity and cell shape oddness. It gives you the full structure for testing.
Nielsen’s Relationship estimates Young’s modulus with a formula. It uses volume fraction and geometry factor. The geometry factor handles pore shape effects.
These tools help designers optimize ceramic foam before making it. You can test virtual versions. Adjust porosity levels to hit your performance goals.
Thermal Stability
Ceramic foam keeps its structure intact across extreme temperatures. Polymer foams and metal foams break down or melt under heat stress. Ceramic foam doesn’t. Three factors control this stability: composition, porosity level, and how you make it.
Thermal Performance Measurement Methods
Engineers test ceramic foam stability with several methods:
Differential Thermal Analysis (DTA) tracks how the material absorbs and releases heat. The Mettler TA 3000 runs under self-pressurizing conditions at a 2 K min⁻¹ scanning rate. It detects signals as low as 0.2 mW. This method spots when breakdown starts and when the material changes phases.
Thermal Activity Monitor (TAM) uses glass containers with 2 cm³ volume. Each holds about 1 g of sample. Combine TAM data with DTA data. You get estimates for SADT (Self-Accelerating Decomposition Temperature). The DTA/TAM method matches US SADT test results within ±7°C for key temperature readings.
Accelerating Rate Calorimeter (ARC) works better with TAM than on its own. The ARC/TAM method gives you tighter temperature ranges. Use this combo for critical safety checks.
Statistical Analysis and Confidence
DTA onset, ARC onset, and TAM data line up well. No bias shows up between methods. This proves the estimation approach works. Confidence ranges curve and get narrowest at the data center. Combined estimates beat single measurements for accuracy.
DTA or DSC alone works fine for basic thermal checks. Add TAM testing for tighter precision. Save ARC testing for critical cases that need maximum accuracy.
Temperature Cycling Resistance
Rheometer tests measure thermal stability through repeated heat and cool cycles. Engineers track G* (complex modulus) against temperature. Statistics show how performance shifts across cycles. Materials with steady G* values handle temperature swings better. This matters for gear that sees changing temps.
Ceramic foam’s low thermal expansion stops cracks from forming during temperature shifts. The porous structure handles thermal stress by compressing void spaces. Material doesn’t fracture.
Conclusion: The Critical Role of Porosity
Porosity defines ceramic foam. It isn’t just a feature. We see this in molten metal filtration and bone tissue growth. You need high open porosity to filter metal. You need specific connections for bone growth. The “empty space” does the real work.
Managing this porosity requires balance. You won’t find a single “best” level. Your application decides the right fit. Higher porosity improves flow and insulation. But it often reduces mechanical strength. Engineers must find the sweet spot. The material needs to perform its job. Yet, it must stay strong against high heat or stress.
Modern tools moved us past guesswork. We design and check complex pore structures with exact precision using micro-CT. This knowledge serves manufacturers and users well. It helps you pick a material that won’t fail when it matters most.