Every year, casting manufacturers lose millions to a hidden enemy in their molds: metal casting shrinkage. That well-engineered part comes out of the foundry full of voids, cracks, or size errors. Molten metal changes the rules once it starts to cool.
You might be fixing porosity in aluminum castings. Or maybe you’re stopping hot tears in steel parts. Understanding why shrinkage happens is just the start. The real question is: can you stop it before it ruins your production run?
This guide covers the fixes that work. We’ll look at gating systems and riser placement. You’ll see how simulation software spots defects before you pour any metal. We break down the science, the engineering solutions, and the quality control steps that turn out perfect castings instead of scrap.
Here’s what works in practice. No folklore. Just proven methods backed by metallurgy and real results.
What Is Metal Casting Shrinkage (Definition & Types)
Metal casting shrinkage is the volume reduction that occurs as molten metal cools, solidifies, and contracts to room temperature. This isn’t a single event. It’s a series of physical changes caused by heat loss and phase shifts. Metal atoms pack into a tighter structure. This means less overall volume.
Shrinkage occurs in three phases. Each phase brings its own casting problems.
Liquid shrinkage happens first while the metal stays fully molten. You’ll see 1-3% volume loss here. The metal contracts as it cools. Solidification hasn’t started yet.
Solidification shrinkage causes most defects. This phase is also called the mushy zone. The metal shifts from liquid to solid. Atoms pack into a solid structure, creating 3-7% volume loss. Steel alloys shrink 3-4% in this phase. Aluminum alloys reach 6-7% (silicon content in Al-Si alloys cuts this down). Copper alloys can hit 8%. This mushy zone is your problem area. Feeding the casting gets tougher as permeability drops.
Solid shrinkage (patternmaker’s shrinkage) keeps going after the metal solidifies. The solid metal contracts as it cools to room temperature. This linear contraction runs from 1-2.5%.
Here’s a key point: solidification shrinkage and thermal shrinkage overlap but differ. Solidification shrinkage stems from the phase change—liquid turning solid. Thermal shrinkage occurs in both liquid and solid phases as atoms move closer from cooling. Phase-driven volume loss creates different defects than thermal contraction alone.
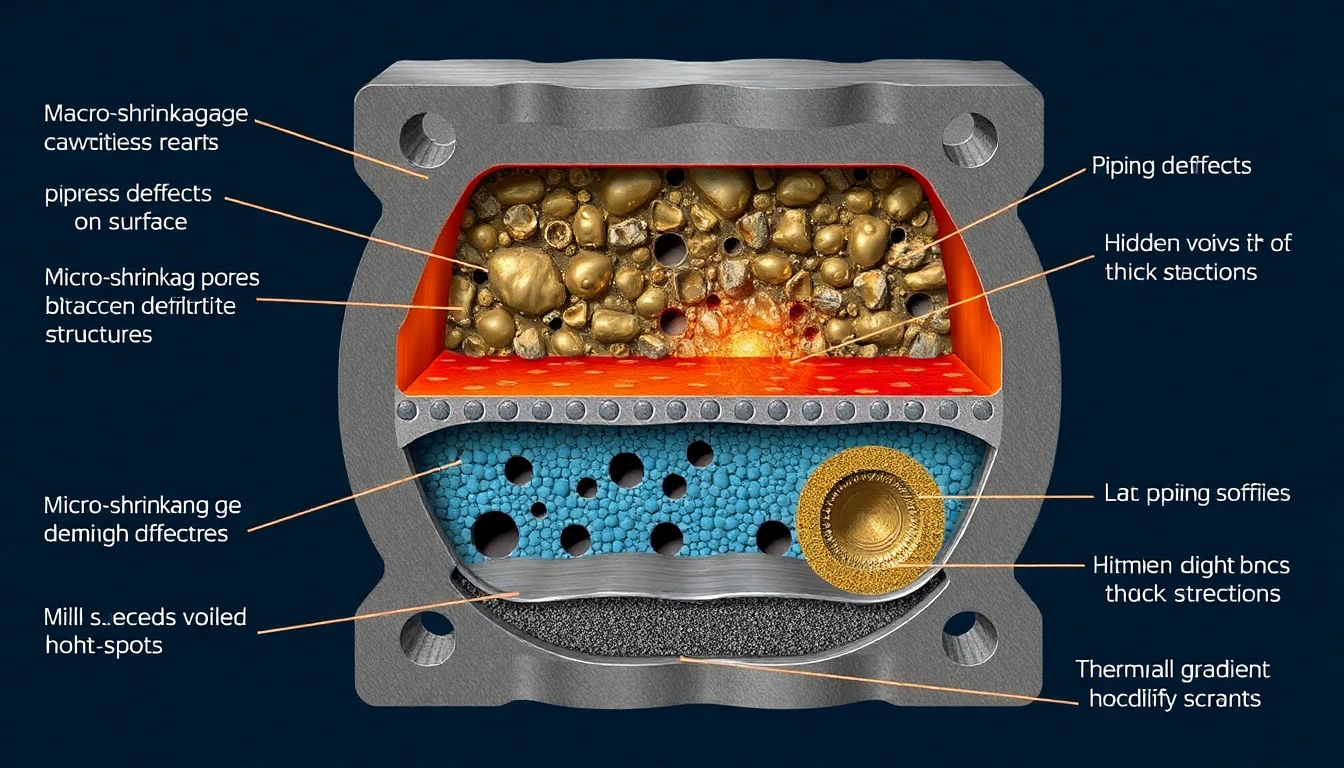
Problems appear as macro-shrinkage—large cavities near risers and thick sections. These weaken the structure. Micro-shrinkage creates tiny scattered pores between dendrites. This kills fatigue resistance. Piping forms open surface cavities from poor feeding. Voids hide inside heavy sections and hot spots—the last areas to solidify.
Root Causes of Casting Shrinkage
Physics doesn’t care about your production schedule. Metal shrinks because atoms pack tighter as they cool. That’s how it works. Liquid metal changes to solid. Density increases. The sections that solidify last need a steady supply of feed metal. Without it, voids form at the center of your part.
Temperature gradients wreck directional solidification. Unequal mold temperatures mean some areas freeze faster than others. Heavier sections hold heat longer. They’re still liquid while thin walls have already hardened. This delay creates isolated hot spots. Pockets of molten metal get cut off from any feed source. The result? Shrinkage voids right where stress concentrates.
Design and Feeding Failures
Larger cope sections break basic solidification rules. The top half of your mold holds more volume than the drag. You’ve created inverse solidification. Heat rises. Metal in the cope stays molten longer but can’t pull feed metal against gravity.
Insufficient riser feeding makes the problem worse. Undersized risers run out of liquid metal before the casting finishes solidifying. Even worse: risers that aren’t filled all the way during pouring. A SG 500/7 automobile body casting showed this pattern. Shrinkage disappeared after enlarging the riser and ensuring full fill. That’s a 100% defect elimination from fixing two variables.
Ingates matter more than most engineers admit. Undersized gates solidify first. They choke off the liquid feed path. Internal sections collapse under atmospheric pressure with nowhere to draw replacement metal.
Process Parameters That Amplify Shrinkage
Pouring temperature walks a tightrope. Pour too hot and you increase total shrinkage through superheating. More heat means more contraction. Pour too cold and you get incomplete mold fill. This traps air and creates cold shuts that block metal flow.
Pouring speed creates its own turbulence. Too slow allows early solidification. Too fast generates flow patterns that interfere with freezing.
Zinc high-pressure Die casting magnifies every mistake. High thermal conductivity does this. Small gate areas and incorrect mold cooling create extreme thermal gradients. Gates freeze almost right away. This kills any chance of compression feeding.
Design-Based Prevention: Gating, Risers & Mold Optimization
Optimization beats guesswork. Three engineering decisions separate scrap-heavy foundries from profitable ones: gate placement, riser sizing, and data-driven mold design. Get these right and you cut porosity by 18%. You also push yield up 16%. Get them wrong and you’re throwing money into the scrap bin.
Gating System Design That Works
Your gating system controls how metal enters the mold. The choke section and sprue height ratio are your primary control variables. Mathematical models use these ratios to predict flow patterns before you pour a single casting.
In-gate height follows a simple rule: two times the diameter of the in-gate itself. This ratio keeps flow smooth during the critical fill phase.
Parting line gating delivers higher mold filling rates than bottom gating. It also generates lower turbulence. Less turbulence means fewer defects. The choice seems obvious. But part geometry and draft requirements complicate things.
Riser Sizing Based on Modulus, Not Hope
Feeder riser design follows one firm principle: riser modulus must exceed 1.2 times casting modulus. Modulus equals volume divided by surface area. This ratio ensures the riser stays liquid longer than the casting section it feeds.
Height-to-diameter ratios matter before you calculate dimensions. Different alloys need different h/d ratios. Aluminum castings run leaner ratios than steel. The riser’s job is simple: provide molten metal at shrinkage points so cavities form in the riser, not your part.
Genetic algorithms maximize casting yield through single-objective optimization. The algorithm tests thousands of riser configurations in simulation. Solutions that don’t meet constraint functions get eliminated. What remains are Pareto-optimal designs. These give you multiple valid options. You trade off between shrinkage porosity, flow velocity, and yield.
Multi-Objective Optimization in Practice
Real optimization balances three competing goals:
– Minimize shrinkage porosity
– Minimize flow velocity
– Maximize casting yield
Three constraint functions limit the search space. This keeps solutions practical and easy to make. Every non-dominant solution the algorithm generates must satisfy these constraints. Otherwise it gets rejected.
Process Control: Cooling Rates & Pouring Parameters
Pouring temperature and cooling rate aren’t suggestions. They’re engineering specs with real consequences. Shift pouring temperature by 100°C and your secondary dendrite arm spacing changes by 6 micrometers. This difference decides if your casting meets fatigue needs or fails in use.
Pouring temperature control starts with exact ranges. Thermal analysis cups need 1235–1369°C based on mass (268–390g samples). Drop temperature from 750°C to 650°C in aluminum casting. You’ll compress dendrite arm spacing. Pouring temperature affects structure more than mold temperature changes. The data shows it.
Cooling Rate Engineering for Structure Control
Controlled cooling runs at 0.2 ± 0.05°C per second in ceramic cup tests. This tight range separates chemical effects from heat variables. Metallurgy and process control work together. But you can measure what each one does.
Mold temperature changes create clear structure shifts:
-
350°C mold temperature produces 25.2 µm SDAS
-
250°C mold temperature (no water cooling) drops that to 19.9 µm
-
250°C mold temperature with water cooling hits 19.4 µm—the lowest point
Water cooling lowers SDAS at every temperature level. The reduction isn’t straight-line. Returns shrink as you reach the best heat removal rates.
Secondary cooling in steel casting controls slab surface temperature. It marks where the liquid pool ends. Superheat concepts work with online temperature tracking. This gives you steady, accurate, and active control. You’re not fixing defects later. You stop them during hardening.
Thermal Analysis as Process Tracking
The lowest temperature of eutectic arrest stays stable across different cup masses and pouring temperatures. This makes it reliable for controlling inoculation potential. Your thermal analysis must tell inoculated from non-inoculated metal. Mass and temperature shifts don’t matter.
Carbon equivalent calculation uses this formula: CE_AT = 14.45 + 0.0089 (TAS). TAS ranges from 1210–1203°C. You get CE values of 3.64–3.71%. Chemical analysis shows 3.67–3.72%. That’s proof, not guesswork.
Dendrite Coherency Point (DCP) temperature drops with Si, Cu, Mg, Zn, and Ti additions. These clear shifts let you use real-time thermal analysis as a tracking tool. You’re reading hardening behavior as it happens. You’re not guessing from old castings.
Practical Process Changes
Cup mass estimation works through heat balance. Cooling rate depends on cup mass and maximum temperature (T_max). You can estimate mass from cooling curve data. Weighing cups during production doesn’t work. The math does it.
Thermocouple placement decides data quality. Put sensors at the hot spot where heat transfer from nearby areas is lowest. The problem: that hot spot moves along the center axis during hardening. Fixed placement gives you some information, not all.
Part shape or tooling limits your cooling rate changes? Switch to chemical mix fine-tuning. Target the higher Silicon range in your alloy spec. Add exact Titanium control. You’ll get finer SDAS without changing the casting cycle. Production schedules stay locked while quality needs get tighter.
Strong links between alloy chemistry and thermal events—especially DCP—let you use on-site thermal analysis. You’re predicting final structure before destructive testing. Quality control becomes active instead of reactive. Test results prove what your thermal curves already showed.
Material Selection: Alloy Composition Adjustments
Silicon content controls metal casting shrinkage in aluminum alloys. Look at the data: Al-10Si alloy delivers a top quality index with 549 MPa ultimate tensile strength and 16% elongation. Al-12Si pushes strength higher but trades some flexibility. Al-4Si gives you maximum stretch for parts that need to bend more than resist force.
Here’s what happens in real production. More silicon means stronger parts. It also cuts down on solidification shrinkage. Al-Si-(Mg) selective laser melting alloys show this across different mixes. A custom Aluminum Alloy reached 560 MPa UTS with over 6% elongation at 90° test direction. That’s ready-to-ship performance from choices made before casting starts.
Energy density of 35 J/mm³ splits clean structures from flawed ones. Below this mark, you fight porosity and incomplete fusion. Above it, both UTS and elongation improve. Process settings work together with alloy composition. You can’t fix one without adjusting the other.
Predictive Models Cut Trial Batches
Machine learning models predict mechanical properties from composition data. MLPReg forecasted the Al-10Si performance numbers. No test castings required. XGBoost models for titanium alloys hit R² values of 0.94 with 3.2% prediction error at 600°C. These tools cut out expensive trial runs.
Aluminum has the biggest effect in quinary high-temperature titanium alloys. SHAP analysis ranked elements: Al > Si > Mo > Nb. More aluminum links to higher UTS through positive SHAP values. The model’s RMSE of 53.31 MPa and MAE of 42.93 MPa beat human guesses from experience.
Steel alloy equations measure how elements interact for yield strength and toughness. The model: ˆx5 = 0.688 – 0.148×1 – 0.390×2 + 0.367×4 + 0.061×6 + 0.496×7 + 0.111×10 – 0.015×13 – 0.222×14. Each number shows how much that element changes your target property.
Adding Gaussian noise to data improved scores across all algorithms. XGBoost jumped from 0.87 to 0.92. Random Forest climbed 0.84 to 0.88. Lasso regression gained ground from 0.83 to 0.86. More training data—even artificial variations—makes models work better for real production calls.
Pick your alloy based on clear trade-offs. Want maximum strength? Go high-silicon. Need maximum stretch? Drop to Al-4Si. Want both? Al-10Si hits the balance point. The data takes out the guesswork.
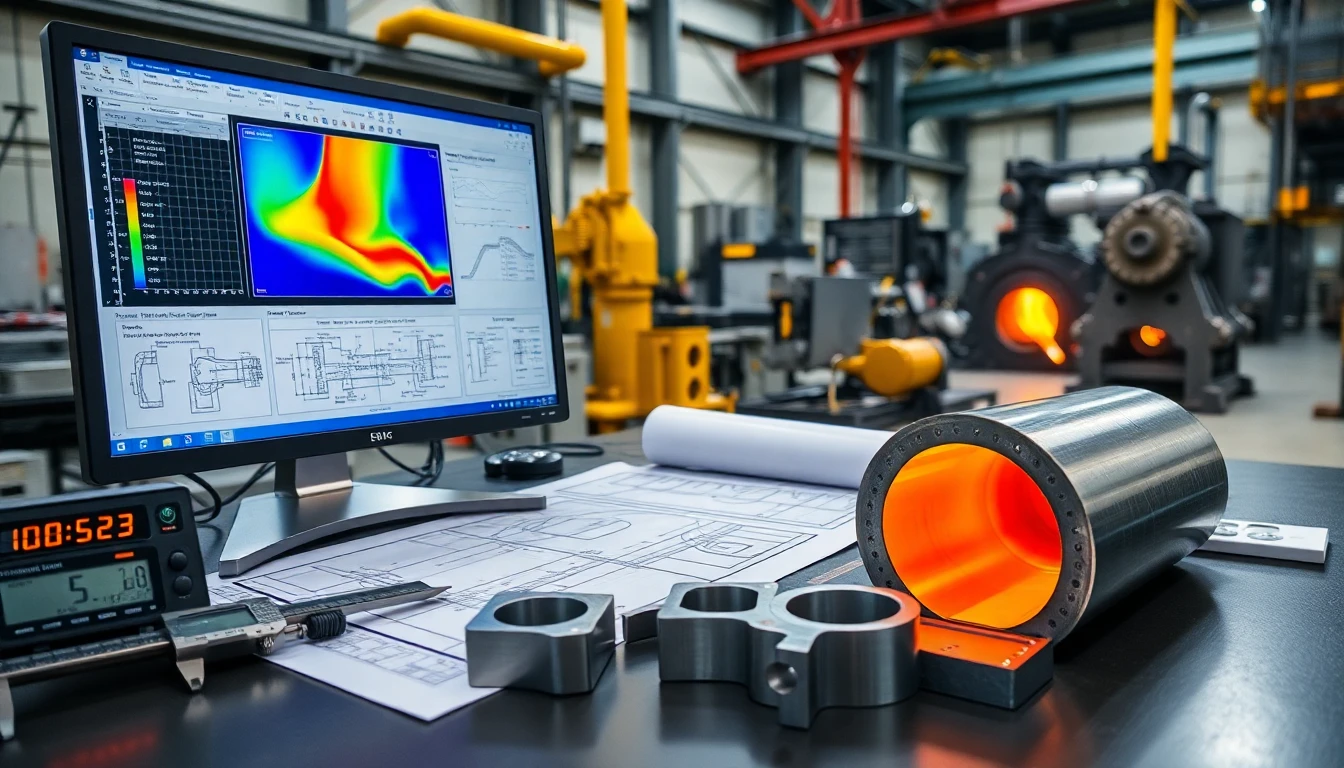
Advanced Technology: Simulation Software & Predictive Modeling
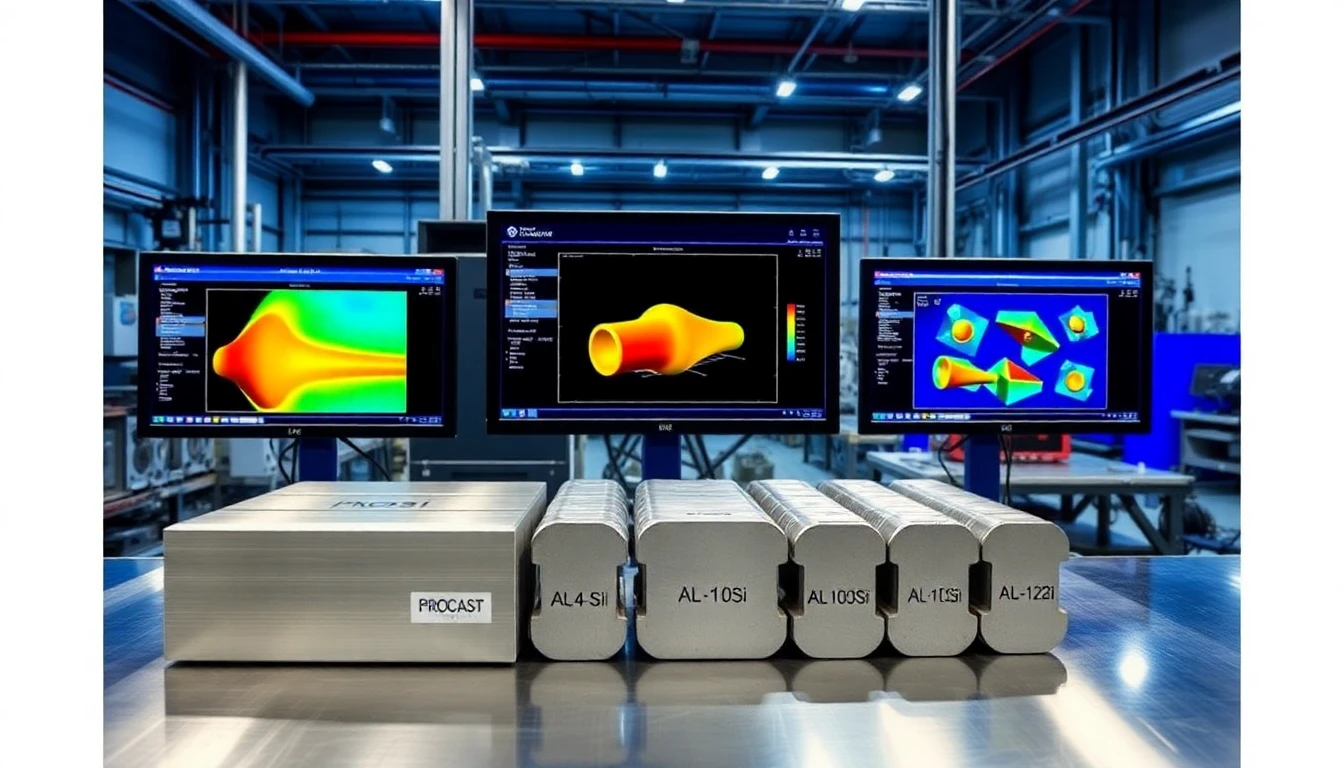
Three platforms lead metal casting shrinkage prediction: ProCAST, MAGMA, and AnyCasting. Each one cuts trial production costs. They show you where defects will form before metal enters the mold.
ProCAST handles complex tasks. Its thermal-metallurgical modeling works across multiple scales. You get microstructure predictions with shrinkage analysis. Adaptive meshing tackles irregular shapes that break simpler tools. Automotive engine block testing ran 50+ physical casts against ProCAST predictions. Error stayed under 2mm. That’s 94% accuracy on shrinkage void location and size.
MAGMA runs in 2,300+ facilities worldwide. It’s saved manufacturers $567M in operating costs through production line improvements. The software tracks three key phases: filling, solidification, and porosity formation. Steel casting accuracy hits 92-97% for defect prediction. A turbine housing case study proved the numbers—96% match between predicted and actual porosity. The manufacturer cut scrap by 18% across 1,200 production runs.
AnyCasting delivers faster results for sand and die casting operations. Real-time metal flow visualization shows you problems as the simulation runs. The shrinkage module accuracy ranges 90-94%. Wheel rim makers using AnyCasting reported 1.5% error between predicted and actual defect rates. That precision translated to 15% scrap reduction. Trial production costs dropped 20% compared to physical testing methods.
The ROI Numbers That Matter
Virtual simulation cuts $2,500 per employee in training costs alone. Scale that across manufacturing operations and the savings pile up fast. Toyota and GE reported $892M in combined cost reductions through digital twin use. They optimized 45,000 production lines. Development cycles dropped by 8,750 hours.
Here’s the investment-to-savings breakdown:
|
Technology |
Annual Investment |
Operational Savings |
ROI Multiple |
|---|---|---|---|
|
AI Simulation Platforms |
$4,870M |
$892M |
2.1x |
|
Factory Simulation |
$450M |
20% trial cost reduction |
3-5x |
|
CAD/CFD Integration |
$11,380M |
8,750hr cycle time cuts |
4x |
Factory simulation delivers 3-5x returns by removing physical prototypes. You’re testing on computers instead of scrapping metal. Flow defects drop 15-25% with visualization tools throughout the design phase.
The simulation market tells the adoption story: $72.44B in 2024, projected to hit $172.33B by 2033. That’s 11.44% compound annual growth driven by proven predictive ROI. Manufacturers who invest now capture competitive advantages. They get faster time-to-market and lower defect rates.
Quality Control: Inspection Methods for Shrinkage Defects
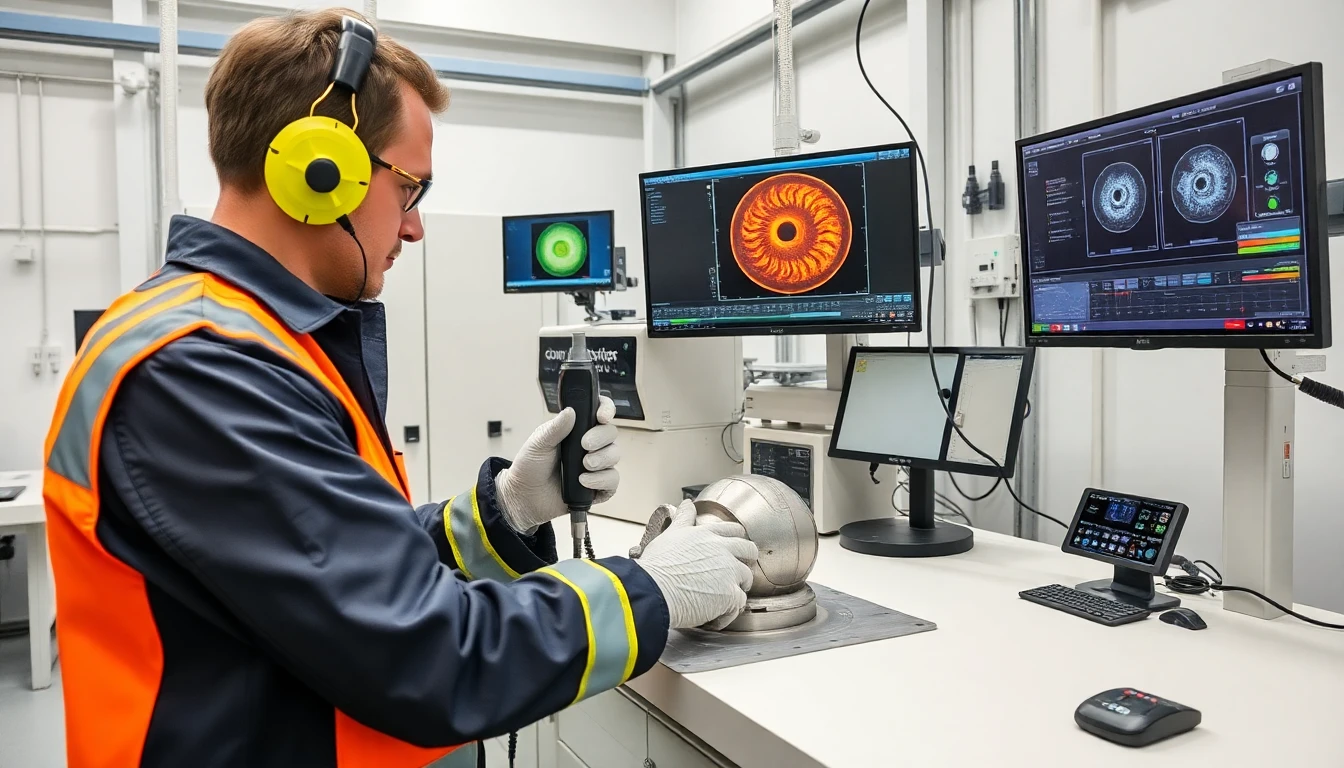
Find shrinkage defects before parts leave your facility. This saves more than reputation—it saves lives. Five core non-destructive testing methods detect internal and surface shrinkage: radiography, ultrasonic testing, eddy current, magnetic particle testing, and dye penetrant testing. Each method targets specific defect types and locations.
Radiography penetrates thick sections to reveal internal voids. X-ray imaging shows shrinkage cavity size and spread. Commercial castings undergo X-ray testing to measure shrinkage before validation. The images feed into stress analysis models. You’re not just documenting defects. You’re predicting how they’ll behave under load.
Ultrasonic testing bounces sound waves off internal gaps. Reflections map hidden pores that visual inspection misses. This method works best for flat defects and larger voids in heavy sections.
Magnetic particle and dye penetrant testing expose surface-breaking shrinkage. Magnetic particle testing works on magnetic materials. Dye penetrant works on any non-porous surface. Both methods highlight cracks and pores that radiography might miss.
Market Reality Check
Defect inspection equipment demand keeps climbing. The semiconductor defect inspection market hit USD 5,603.5 million in 2024. Projections show growth to USD 12,154.3 million by 2025 and beyond. advanced inspection technology investment isn’t optional anymore—it’s the price of staying competitive across all manufacturing sectors.
Industry-Specific Applications & Case Studies
Metal casting shrinkage affects every industry. Aerospace, automotive, mining, and heavy machinery makers all deal with the same physics. How they respond makes the difference. Companies that treat shrinkage as an engineering problem see real financial returns. Those that accept it as “normal scrap” keep losing money.
Manufacturing: Six Sigma Turns Data Into Profit
Mosaic Corporation’s Six Sigma team proved the business case. They boosted productivity by more than 50% using Minitab for process improvement. The financial impact topped $12 million per year. That’s not from buying new equipment. It came from finding which process factors caused shrinkage defects and fixing them one by one.
DuPont Building Innovations took waste reduction further. They cut landfill waste from 81 million pounds per year to zero through Minitab data analysis. Stop producing scrap castings, and you stop throwing away raw materials, energy, and labor hours. The environmental win also meant a cost win.
Maxion Wheels integrated Minitab Engage across their automotive wheel casting operations. Annual cost savings jumped more than 19%. OneSteel’s Laverton Rod Mill used Six Sigma with Minitab to reduce mill scale on steel rods. Better yield meant better profit on every production run.
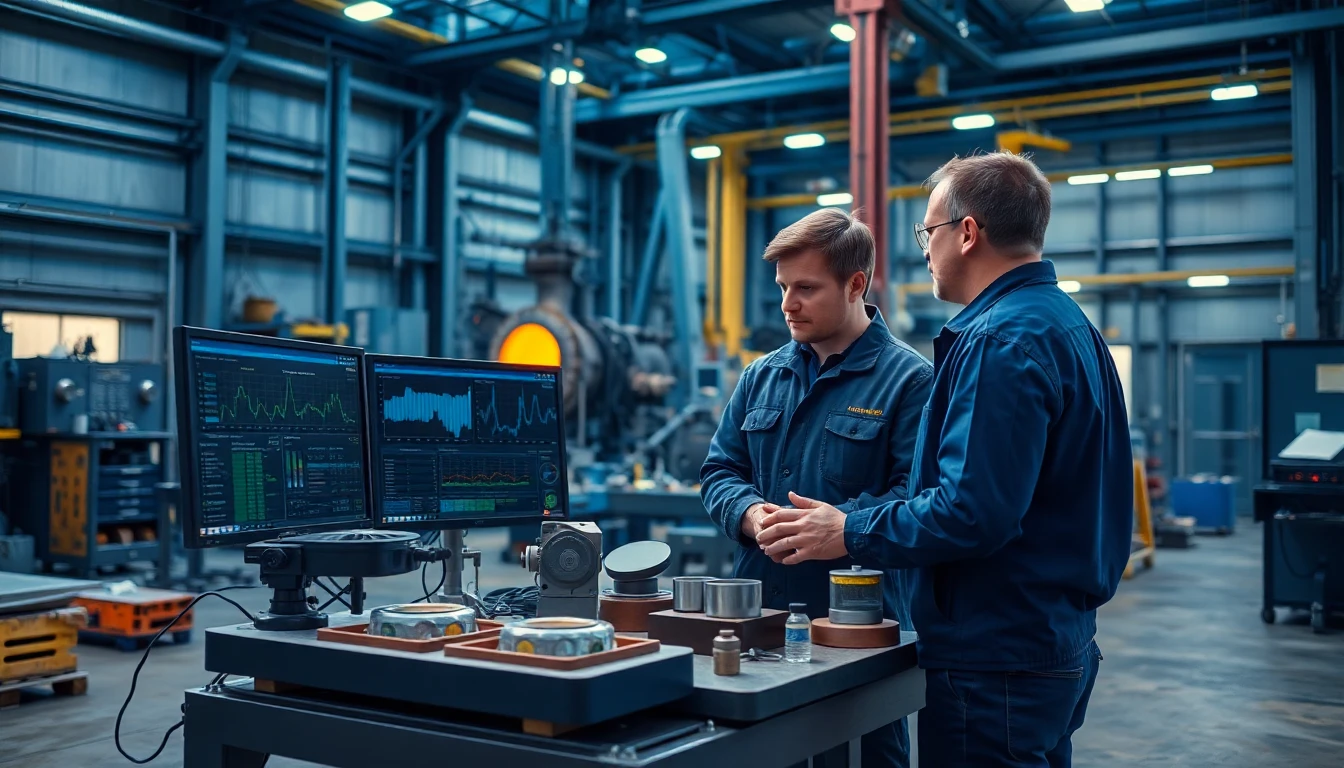
Heavy Industry: Predictive Maintenance Stops Problems Before They Start
Tata Steel installed IoT sensors on casting machinery. The sensors tracked temperature, vibration, and pressure in real-time. This data stream cut breakdowns, lowered maintenance costs, and reduced production delays. You’re not fixing shrinkage defects after they form. You’re keeping the thermal conditions that prevent them.
GE applied the same sensor strategy to jet engines and wind turbines. Predictive maintenance on casting equipment uses the same logic. Monitor thermal gradients. Track cooling rates. Flag problems before they produce bad parts.
Caterpillar used machine learning to analyze field data from heavy equipment. The goal: prevent breakdowns during key agricultural seasons. The technique works for foundry operations too. Analyze past shrinkage patterns. Predict which mold setups will fail. Adjust before pouring metal.
Mining: Every Load Matters
Fresnillo Plc’s Saucito mine applied Lean Six Sigma with Minitab to optimize silver recovery. Revenue increased by more than $2 million per month. Newcrest Mining’s Cadia Hill operation used Minitab to get one extra ore load per truck per day. Mining equipment includes cast parts that face extreme wear. Shrinkage defects shorten component life. Better castings mean fewer replacements and less downtime.
A semiconductor plant in Thailand used Minitab to forecast electricity use. They matched budget with production schedules to maximize profit. Casting operations use massive energy during melting and pouring. Predict power needs well, and you optimize both production timing and cost structure.
Conclusion
Metal casting shrinkage doesn’t have to hurt your production quality. Manufacturers who deliver defect-free castings know one thing: shrinkage prevention is a step-by-step approach. It touches every phase of your operation.
Start with smart design. Your gating systems and riser placement form your first defense. Pair that with precise process controls. Match cooling rates to your alloy’s behavior. Dial in pouring temperatures just right. Use simulation software to spot problem areas before metal hits the mold. You’re not just stopping defects. You’re building predictability into your workflow.
Ready to eliminate metal casting shrinkage in your next production run? Review your current process against the strategies outlined here. Find your weakest link. It might be design, material selection, or cooling control. Tackle that first. Small, methodical improvements add up fast. The castings your customers demand are within reach. Treat shrinkage as a solvable engineering challenge. Don’t accept it as a cost of doing business.