Foundry QC engineers know the problem well. Batch 47 from your filter supplier runs clean, but Batch 48, ordered under the same spec sheet and part number, leaves unexplained inclusion defects in your castings even though nothing changed on your end.
The cause usually traces back to inconsistent mesh density, weave tension, or porosity that slipped out of the supplier’s warehouse unchecked. Batch-to-batch variation in Fiberglass mesh filters eats into yield rates until someone measures the material.
This guide outlines the testing protocol, including sampling plans, measurement tools, and pass/fail thresholds, to separate suppliers who claim consistency from those who prove it batch after batch.
Why Batch-to-Batch Consistency Matters for Fiberglass Mesh Filters

A 50-micron mesh opening is a hard spec. fiberglass mesh filters rate between 50–200 µm, while standard woven screens catch inclusions above 100 µm. Shift that opening size, loosen the weave density, or leave the mesh uneven, and you change how much slag and refractory debris reaches the mold.
The Real Cost of Overlooking Variation
Inconsistent batches drive specific, traceable defects:
-
Slag inclusion: Oversized openings or broken yarns let oxide films and refractory particles slip through.
-
Porosity: Altered flow resistance increases turbulence, trapping air and oxides.
-
Misrun and cold shut: Tight mesh or uneven coating slows metal flow below the threshold needed for complete fill.
-
Sand inclusion: Dimensional drift prevents the filter from seating cleanly, scraping mold sand loose.
Filters represent 3–7% of total casting production cost. But when a batch fails mesh filter uniformity testing and enters production, defective castings generate 8–15% scrap rates, with rework climbing past 18% of unit production value.
Step 1: Establish Approved Specification Baseline (fiberglass filter mesh specifications)
Before any batch gets flagged for drift, you need a locked reference point. Skip this step, and consistency becomes a guess based on memory instead of data.
A proper baseline documents every measurable trait of the approved mesh:
|
Parameter |
Baseline Reference Value |
|---|---|
|
Mesh opening |
0.80–2.5 mm (warp × weft), measured aperture rather than mesh count alone |
|
Open area |
50–60% starting benchmark, set per alloy and retention target |
|
Thickness |
0.35–0.55 mm standard; 0.65–0.85 mm high-silica; up to 1.5 mm heavy-duty |
|
SiO₂ content |
58–65% standard-silica; ≥96% high-silica |
|
Tensile strength |
Warp ≥600 N/5cm, weft ≥420 N/5cm; ≥1,000 N/5cm for molten-metal filtration |
|
Max temperature |
≤800°C standard; ~1,000°C continuous, 1,400–1,620°C short-term for high-silica |
Alloy-specific minimums matter too. Gray iron pours under 100 kg run 1.5 mm openings; Ductile Iron up to 100 kg uses 2.0 mm. Lock these figures into a controlled document with a revision number, approved sample, and supplier sign-off. This document becomes your single source of truth for Fiberglass filter mesh specifications across every future shipment.
Step 2: Design a Statistically Valid Sampling Plan (production batch testing filter)
Grabbing one filter from the top carton and calling it tested tells you nothing. A single lot means one distinct batch: same supplier, same specification, same production date, same line, and same lot number. Mixing different dates or grades into one sampling pool corrupts your inspection records.
Pull samples from the beginning, middle, and end of the physical lot. Sampling random cartons across all three points catches process drift that develops mid-run on the production line.
Sample Size Based on Risk Level
-
Routine incoming inspection: 5–10 packages per batch (2 beginning, 1 middle, 2 end for 5 units; 3-4-3 split for 10 units)
-
New supplier or first three lots: tightened inspection at 10–20 units, pulled from every pallet where practical
-
Problem batch: quarantine the lot and inspect 20–30 units, or apply an ISO 2859-1 tightened plan—whichever demands more
This setup follows AQL-based attribute sampling under ISO 2859-1, linking lot size and acceptance quality levels directly to sample sizes and rejection thresholds. For foundry filter QC, that structure gives you documented consistency on paper.
Escalation Triggers
Switch to tightened inspection when you encounter:
-
Any critical defect tied to safety or primary function
-
One confirmed major defect in routine sampling
-
Repeated defects in 2 of 5 consecutive lots
-
Missing or contradictory batch certificates
Quarantine the lot, alert Quality, investigate the cause, and return to normal inspection after three consecutive conforming lots.
Step 3: Conduct Visual and Dimensional Inspection
Numbers on a spec sheet mean nothing if nobody checks the physical mesh against them. This step turns your baseline into a clear pass/fail call, tied to ISO 9044, ASTM E2016, or ASTM E11/ISO 3310-1 when the filter serves as test-sieve cloth.
What to Look For Visually
Inspect both faces and the full perimeter under diffuse, shadow-free light at 500–750 lux, increasing to 1,000–1,500 lux for tighter tolerances. Add angled light to catch scratches, wrinkles, and raised resin that flat lighting hides. Flag any of these:
-
Broken, missing, double, or bent wires
-
Uneven coating, bare spots, blisters, or delamination
-
Blocked apertures, resin buildup at intersections, or burrs
-
Discoloration, contamination, or wrinkling
Photograph every rejectable defect and log the location, panel number, and inspector.
What to Measure
Use calibrated tools only: a steel rule, vernier caliper, micrometer, and an optical system with resolution below 0.1 mm for aperture checks. Measure pitch across 10 openings, divide by 10, and subtract the wire diameter to calculate the true clear aperture. Check at least 5 points per panel plus both edges, skipping the outer 10 mm.
Typical tolerances run ±0.05–0.10 mm on wire diameter and ±2–5 mm on opening size. Compare every characteristic against the drawing—mesh count alone tells you nothing.
Step 4: Measure Mesh Opening and Open-Area Consistency
Mesh count numbers lie. A filter stamped “40 mesh” tells you nothing about actual retention until you measure the clear opening between wires instead of the center-to-center pitch. This step turns raw measurements into verification data that catches the drift mesh count alone hides.
Sample Prep and Measurement Method
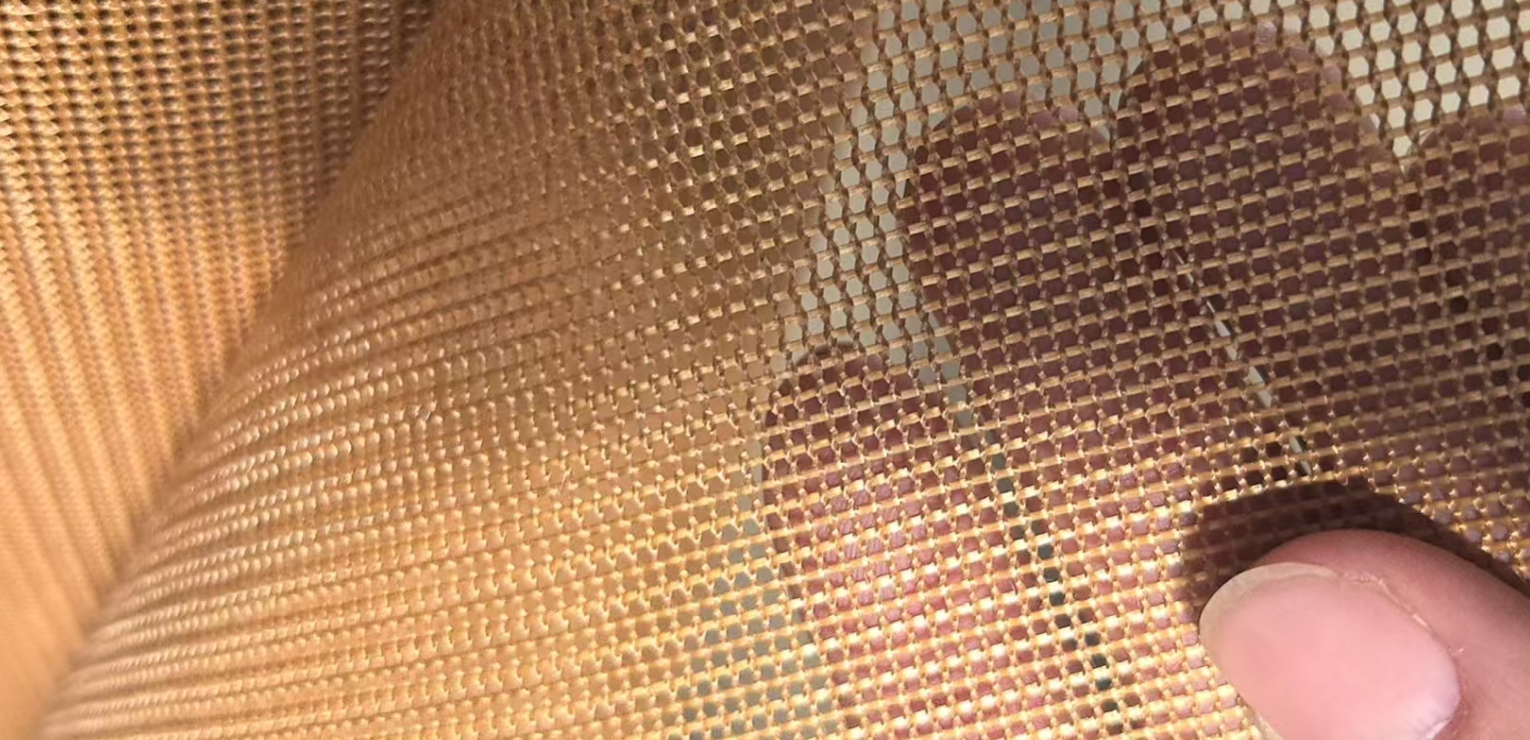
Pull samples across the batch width, length, edges, and center zones. Log the batch number, location, warp and weft directions, nominal aperture, and spec. Clean the mesh with airflow or a soft brush; liquid cleaning shrinks fiberglass, swells resin, or migrates coatings. Lay samples flat on a high-contrast stage and smooth out wrinkles. Never stretch, compress, or reshape the mesh.
Use a calibrated microscope, optical projector, or ruler-equipped image system with fixed magnification, focus, exposure, and threshold settings. Measure at least 10 openings per direction (warp and weft) for routine checks, then expand to 30–50 per direction for release or dispute testing. Record the net opening width (w) between adjacent wires alongside the long and short axis dimensions instead of pitch.
Mesh Density and Open-Area Calculation
For square mesh, calculate the opening using w = 25.4/M − d, where M is mesh count per inch and d is wire diameter. Never certify Fiberglass mesh grade on mesh count alone. Report net aperture for warp and weft separately, alongside wire diameter, pitch, and open area.
Calculate the mean, standard deviation, minimum, maximum, and range for each direction, as rectangular openings cannot share one average. Flag any coefficient of variation above your internal threshold. For irregular fiberglass weaves, calculate open area through image analysis (open pixel area ÷ total area × 100). For regular weaves, calculate it geometrically with OA% = (w/(w+d))². ASTM E11 applies only to metal test-sieve cloth; borrow its terminology, but set your internal fiberglass acceptance limits independently.

Step 5: Perform Mechanical Tensile Testing (fiberglass filter manufacturing tolerance)
A mesh can look perfect under a microscope and still fail in the mold if molten metal pressure tears it apart. Tensile testing catches that gap.
Run a strip-tensile procedure per ASTM D5035 (woven or nonwoven) or ISO 13934-1 for woven fabric. Cut specimens in both the machine direction (MD) and cross direction (CD). For routine production control, test five specimens per direction per batch, taking samples across the left edge, center, and right edge of each roll.
Set your calibrated tensile tester to a 25.4 mm strip width, a 101.6 mm gauge length, and a 12.7 mm/min crosshead speed. Report results in N/5 cm, and never mix units across one spec.
Reject results showing:
-
Fiber rupture or a sudden load drop
-
Failure through a seam or splice instead of the gauge section
-
Elongation far outside the approved range
-
Any MD/CD value below the supplier minimum (a common benchmark is 1,600–2,000 N/5 cm)
For high-temperature filters, compare pre- and post-heat strength after 500 hours at the rated service temperature. The batch must maintain at least 70% strength retention; anything lower fails, regardless of the initial numbers.
Step 6: Validate Thermal Resistance and Casting Performance (foundry filter QC process, casting filter reliability)
A filter that survives the microscope can still crack the moment molten metal hits it. Lab data does not predict real pour behavior, so you have to test under actual casting conditions.
Thermal-Shock and Wash Testing
Pour molten metal through the filter in a representative gating setup, then inspect right away for cracks, broken struts, washout, softening, or detached ceramic. Aluminum trials expose filters to 700–750°C, where inadequate preheating is the primary cracking risk. Preheat aluminum filters to at least 400–500°C (some operations push to 600–650°C) with a minimum 30-minute soak. Record the filter temperature before the pour, along with metal temperature, contact time, and crack locations. For Ceramic foam Filters, benchmark compressive strength at room temperature: 0.4 MPa minimum, 0.6–0.8 MPa for good quality, and above 1.0 MPa for premium grades.
Gas-Evolution and Compatibility Checks
Heat a representative sample to pouring temperature and collect gases in a controlled chamber. Log total gas volume, peak evolution rate, and any odor, smoke, or condensable residue. A dry, stable filter will show no visible binder decomposition or moisture flash-off before metal contact. Ceramic filtration removes solid oxides. To handle dissolved gas, use rotary degassing or fluxing.
Verify molten-metal compatibility by alloy. Alumina suits aluminum inclusions, silicon carbide handles higher thermal shock, and zirconia fits demanding steel applications. After the trial, inspect the filter for erosion, coating dissolution, or metal penetration.
Flow-Rate, Inclusion Capture, and Documentation
Measure fill time, mass flow rate, and pressure drop while keeping filter area, PPI, and gating geometry consistent. Maintain 30–50 mm of metal above the filter surface during the pour. Compare filtered and unfiltered castings through metallographic cross-sections to verify capture; Ceramic foam filtration targets inclusions 10–20 microns and larger. Change only one variable per trial, and keep full records of the batch number, preheat temperature, mold fill time, and defect rates for misruns, porosity, and inclusions.
Acceptance Matrix: Setting Pass/Fail Criteria (foundry filter quality inspection)
Six inspection steps generate data. An acceptance matrix turns that data into a decision. Build one master sheet listing every characteristic, test method, pass threshold, and exact fail trigger so two inspectors never reach different conclusions from the same reading.
|
Characteristic |
Pass Reference |
Fail Trigger |
|---|---|---|
|
Pore size/PPI |
Within ordered PPI range; ceramic foam 10–60 PPI |
PPI out of spec; D10/D50/D90 exceeded; blocked or oversized pores |
|
Thickness |
Per drawing; common range 10–50 mm, tolerance ±1–2 mm |
Any point outside tolerance; sealing or flow-channel failure |
|
Open porosity |
~80–90% for ceramic foam |
Below order minimum; porosity-PPI mismatch |
|
Cold crush strength |
≥1.0 MPa |
Chipping, delamination, below spec |
|
Thermal shock |
No through-crack after test |
Cracking, collapse, erosion |
Classify every nonconformity by severity. Critical defects like cracks, bypass leakage, or gross dimensional failure fail the entire lot on the spot. Major defects trigger the sampling plan’s rejection threshold. Minor defects are logged for trend tracking.
Tie every result back to the raw material lot, forming batch, kiln run, inspector ID, and equipment number. The quality manager signs off after reviewing the data, photos, and COA together. This traceability reveals batch-to-batch variation before it reaches the mold.
Common Batch Variation Patterns and Root Causes
Six root causes explain almost every batch-to-batch filter variation complaint on the shop floor, and most trace back to process drift the supplier never flagged.
Coating and fiber issues: Thick or uneven coating buildup increases rib thickness, shrinking the effective aperture and open area. That restriction hits hardest at high PPI, where flow resistance runs high to begin with. Oversized fiber diameter, higher slurry solids, or a denser substrate narrows pore channels the same way.
Weave and tension problems: Too much weaving tension stretches, flattens, or compacts intersections, reducing aperture size and creating uneven distribution across a single lot. Insufficient tension does the reverse: loose warp and weft enlarge openings and distort pore shape, raising the risk of local metal penetration.
Sintering drift: Over-sintering collapses pore channels and restricts flow, while under-sintering leaves weak bonds that cause dusting and powder shedding.
Dimensional shift: Mold wear, warping, and shrinkage drift from changes in kiln temperature or soak time push length, width, or thickness outside ±1–2 mm control targets. That variance leads to edge bypass and seating failures in the filter box.
Supplier Process-Change Signals Worth Demanding
Push suppliers for specifics beyond average PPI, including fiber grade and diameter, coating solids and viscosity, blade gap, tensioner settings, mold number, and kiln dwell time. Any change across these variables warrants a first-article comparison before the lot ships.

Documentation and Supplier Quality Control Requirements
Paper trails catch what eyeballs miss. Every batch needs a Certificate of Analysis or Conformance tied to the raw material lot, production date, chemistry, and physical results, plus foundry-specific details like alloy composition, furnace heat number, coating lot, and shelf life. FoundryMax links each shipped batch to a unique ID that brings together the supplier lot, calibration status, test method, inspector, and release signature into one traceable chain.
Retain quality records for at least 7 years, though high-risk materials or OEM contracts may require longer. Suppliers must flag material, process, or location changes 30–90 days ahead, with emergency notice delivered within 24–48 hours. Audit stable suppliers every 24 months and new or high-risk vendors annually, with trigger audits scheduled after consecutive nonconformances.
Conclusion
You catch batch-to-batch variation in fiberglass mesh filters through testing. The six-step process outlined here, from dimensional checks to tensile and thermal validation, gives you a repeatable framework for mesh filter uniformity testing that holds up under production pressure.
Set your acceptance matrix before you start sampling, document every deviation (even minor ones), and treat fiberglass filter manufacturing tolerance data as the start of a conversation with your suppliers.
Pull your last three incoming batches and run them through this checklist. If the numbers drift, you have your answer and the proof you need to push back. If you want to skip the guesswork, FoundryMax’s documented QC process handles that consistency check for you.