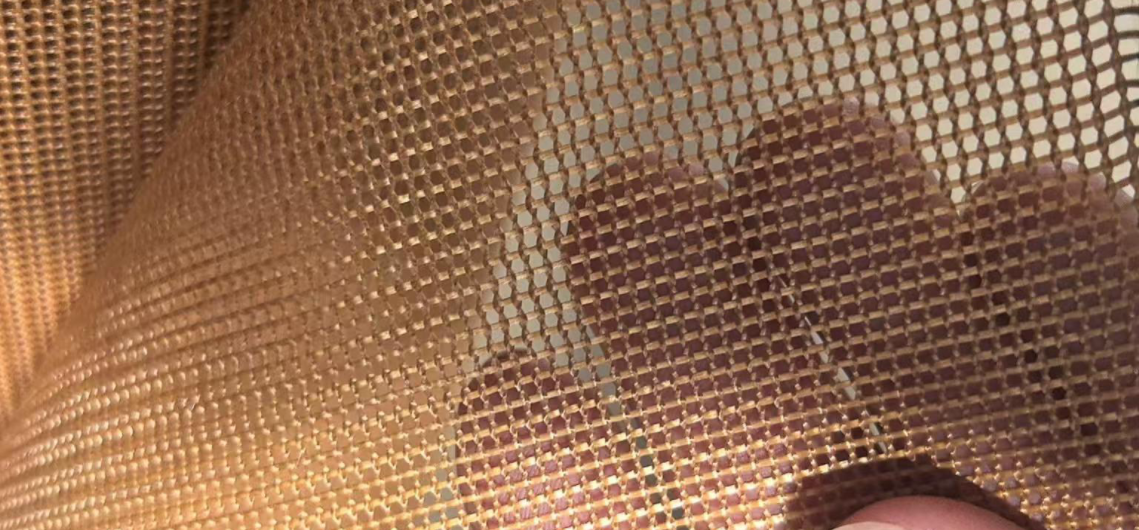
A single defective batch of fiberglass mesh filters can turn a smooth casting run into a costly nightmare—unexpected inclusions, gas porosity, or worse, a rejected shipment that sends your quality manager scrambling for answers. If you’re sourcing filters for metal casting, the difference between a reliable supplier and a risky one often comes down to what happens before you place that bulk order.
This guide walks you through how to test and qualify a fiberglass Mesh Filter before you buy in bulk. You’ll verify mesh opening consistency, run a proper glass fiber filter thickness measurement, and evaluate thermal resistance and mechanical strength under real pour conditions. These are the checkpoints that separate foundry-grade materials from underperforming substitutes. Work through them, and you’ll have a practical framework for purchasing decisions based on data.
Why Pre-Purchase Testing Matters for Fiberglass Mesh Filters
A $5 filter failure can trigger a $500 casting loss. That’s the cost ratio foundries deal with when a cheap, unqualified filter lets inclusions slip through. Non-metallic particles smaller than 60 µm rarely cause trouble. But porosity around 100 µm starts eating into mechanical strength and fatigue life fast.
Filters won’t eliminate every defect source. They cut the odds of sand, slag, and oxide inclusions reaching your mold cavity. Skip verification, and problems like uneven pore size, over-coating, or poor sintering won’t show up until after pouring, turning a single bad filter into a full batch of scrap.
Step 1: Visual & Dimensional Inspection
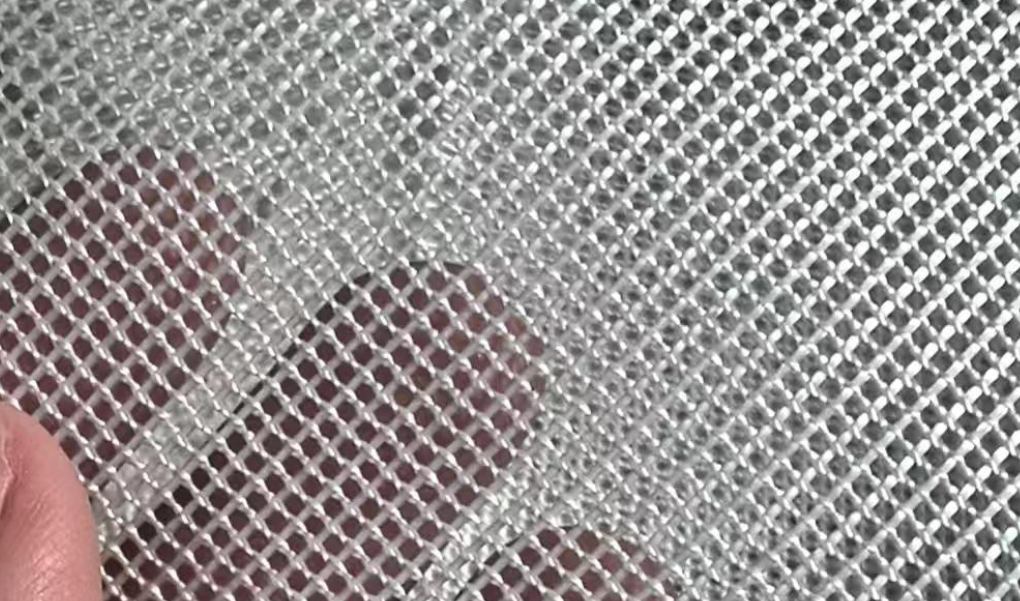
Grab a sample, hold it up to the light, and look for what shouldn’t be there. Visual inspection is your first line of defense, and it costs nothing but ten minutes of attention.
What disqualifies a filter on sight:
– Holes, tears, or open weaves. Under standard 4-Point grading systems, any visible hole earns an automatic 4-point defect.
– Rust stains or oil marks larger than 15mm. Treat these as major defects, full stop.
– Loose weaving, snagged yarns, broken warp/weft, or visible puckering.
Any of these under normal viewing distance? Reject the batch.
Dimensional Tolerance Check
Pull out your calipers for anything under 100mm: mesh openings, edge width, thickness at specific points. You want 0.01mm to 0.02mm resolution here. For dimensions over 100mm, switch to a steel ruler or tape measure.
Tolerance benchmarks:
– Small dimensions (<100mm): ±0.3mm to ±0.5mm
– Larger dimensions (>100mm): ±1% of total length (a 6m filter roll allows ±60mm variance)
Weave angle deviation matters too. Use a set square against the weft direction, measure with a 30cm and 100cm metal ruler, and check three points: head, middle, tail. Anything exceeding 4° deviation signals inconsistent tension during manufacturing. That’s a red flag for batch consistency in foundry materials.
Step 2: Physical Property Measurement (Thickness/GSM/Density)
Numbers don’t lie, and this is where they matter most. glass fiber filter thickness measurement should follow ASTM D6988-13 or an equivalent fabric-thickness method. Measure three points (right, center, left) and take the median as your reported thickness in mm. For a stricter European reference, ISO 4603 applies a 2.0 kPa standard pressure over a 25 cm² foot area, giving you a repeatable, apples-to-apples comparison across suppliers.
Weight per unit area (GSM) comes next, per ASTM D3776. Cut a known-area sample, weigh it, convert to g/m². Common Fiberglass mesh values run 45, 65, 100, 110–130, 145, and 160 GSM. A 145 GSM product typically targets wall, ceiling, and floor-joint reinforcement.
From there, calculate density: density = GSM ÷ thickness (mm) = g/cm³. Raw glass fiber sits around 2.58 g/cm³, but woven structures vary widely: 0.36–0.5 g/cm³ for low-density, high-permeability filters, 0.8–1.5 g/cm³ for higher-strength, tighter-pore variants. You need a thickness gauge, electronic scale, cutting template, and calipers.
Step 3: Material & Coating Verification
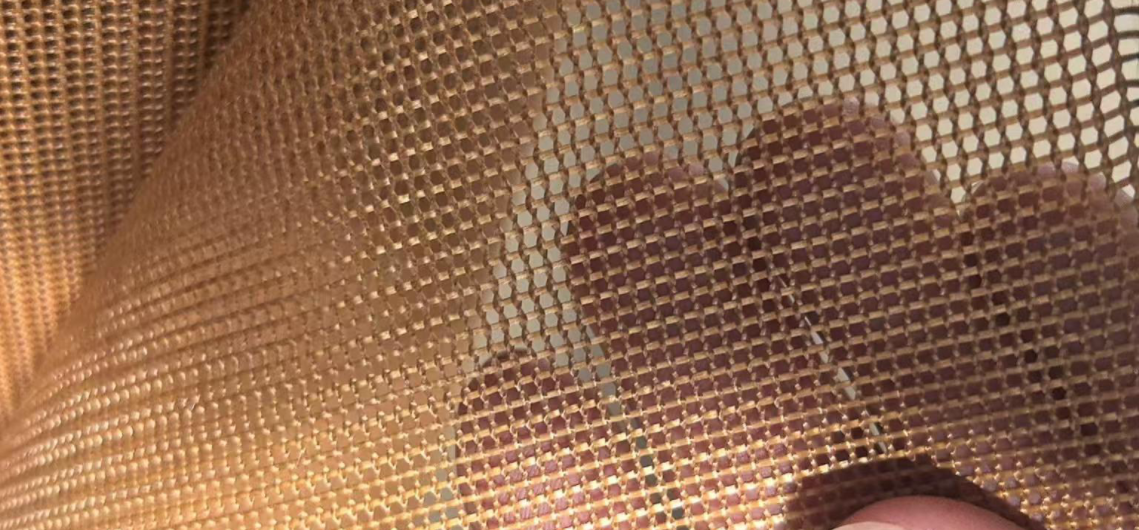
Paper trails matter as much as physical tests. Before you touch a sample, demand the supplier’s raw material COA, MSDS/SDS, batch labels, and fabric spec sheet. Cross-check fiber type, GSM, weave structure, thickness, and resin compatibility against what’s printed on the packaging.
Know your glass fiber type. E-glass works for general electrical applications. ECR-glass resists corrosion. S-glass delivers higher strength. Your purchase order should specify fiber type, fabric GSM, resin system, and target performance. Never write just “glass fiber.” That vague label leaves room for substitution.
For high-risk batches, go further. Burn-off residue analysis and fiber bundle morphology under a microscope catch blended or substituted fibers that visual inspection misses.
Coating Inspection Standards
Dry film thickness gets measured with magnetic or eddy-current gauges, or per ASTM D7091 on metal substrates. Adhesion testing follows two paths. The cross-cut method (ASTM D3359) works for quick screening. Pull-off testing (ASTM D4541) gives you quantified bond strength in MPa.
Run a quick corrosion screen too. A 24-to-96-hour soak in 3-5% NaCl solution reveals blistering or rust before you commit to bulk volume.
Step 4: Thermal Resistance Testing (Temperature Resistance and Thermal Shock Testing)
Heat is where cheap filters die. A mesh that looks perfect at room temperature can crack, warp, or shed particles the second molten metal hits it. That’s why thermal resistance testing sits at the center of any serious qualification process.
Match the filter to your pour temperature first. aluminum casting runs 680–780°C and typically needs alumina-based media rated for continuous service around 1050–1100°C. Copper alloys pour hotter, 1000–1200°C, calling for alumina or mullite-grade filters. Gray and Ductile Iron push into 1300–1450°C territory, where standard aluminum filters can’t survive that thermal load. You need SiC. Carbon steel and stainless steel go even further, 1550–1650°C, demanding ZrO₂ filters rated up to 1680–1700°C.
Running the Thermal Shock Test
The real test is shock resistance. Preheat your sample, then plunge it into molten metal or an equivalent high-temperature bath. Record the first-crack temperature, crack propagation and full fracture, and filtration efficiency loss after exposure.
Aluminum-grade filters should survive 3–6 rapid immersion cycles from room temperature to 1000°C without cracking. Steel-grade media faces harsher conditions: initial pour stages hit filters with roughly 30 seconds per ton of thermal shock at 1400–1650°C. ASTM C1171 offers a useful reference framework (1200°C furnace baseline), though it has limited applicability outside that range.
Track strength retention and shrinkage rate post-exposure. Failure modes like cracking, powdering, collapse, or delamination tell you whether this batch belongs in your foundry or in the reject pile.
Step 5: Mechanical Strength Assessment
Handling damage kills more filters before they reach the pour than anyone admits. A filter that survives thermal shock but crumbles during forklift stacking or shipping vibration never gets the chance to prove itself.
Three tests in sequence tell you what you need to know.
Start with tensile strength. Pull the sample under load, track maximum force and elongation before failure. This confirms the filter survives lifting, bundling, and handling without tearing.
Next, run tear resistance using Elmendorf or Graves tear methods. Pre-cut a notch, measure force needed for the tear to propagate. This catches the real-world risk: filters snagging on casting edges or fixture burrs during transport.
Test compression strength last. For light-to-medium loads, ≥1.0–1.5 MPa serves as a baseline threshold. Heavy-duty applications need ECT (Edge Crush Test) and box compression data instead. McKee’s formula (5.87 × ECT × √BP × T) applies here.
Heavy casting operations demand higher compressive and impact tolerance. Precision casting applications prioritize dimensional stability and low breakage rates over raw strength numbers.
Step 6: Gas Evolution & Volatile Testing
Pinholes and subsurface porosity usually trace back to one thing: too much gas coming from the filter itself. This test catches that problem before it reaches your mold cavity.
The standard procedure pre-dries samples at 105±5°C, then puts a fixed-mass sample into a crucible under nitrogen or inert gas at 850–900°C (temperature held within ±10°C). Gas volume is recorded at fixed intervals over 7 minutes, converted to mL/g, and plotted as a gas evolution rate curve.
Equipment matters here. You need a resistance or tube furnace, a gas collection system (burette or balance-bottle setup), thin-walled copper or ceramic sample boats, and a balance accurate to 0.01g or better. Run 2–3 high-gas test samples first to clear residual gas from the system.
What to demand in supplier reports:
– Total gas evolution (mL/g), not a single spot number
– Full 0–7 minute evolution curve, minimum 1-minute intervals
– At least 3 parallel samples with ≤10% deviation
– Raw data: sample weight, furnace temperature log, timestamps, reader signatures
A 10–20% reduction in total gas evolution versus baseline means real improvement. Anything above 10% parallel-sample variance means retest, no exceptions.
Step 7: Flow Behavior & Pressure Drop Testing
Every filter chokes flow to some degree. The real question is whether that resistance is predictable or swings wildly batch to batch. Molten metal flow behavior filter testing gives you the answer, and it’s the step most buyers skip until a casting comes back short-filled.
Pressure Drop Measurement
Lab simulations calculate flow velocity from pressure differential (ΔP), using molten aluminum density (2375 kg/m³) and gravity (9.8 m/s²) as your baseline constants. One aluminum filtration case recorded a pressure loss of 70 mbar (7000 Pa) — treat that as your comparison point. For ceramic and lattice-style filters, don’t stop at pressure drop alone. Pair it with velocity distribution data to see how filtration efficiency and flow resistance actually spread across the filter face.
Strength testing under simulated pour pressure matters too. Three-point bend tests and two-point rod compression tests reveal the failure threshold — the point where the filter buckles under real gating pressure, not lab-ideal ones.
Fill Time and Thin-Wall Risk
High-pressure die casting typically runs a 20–100 ms cavity fill time. Complex thin-wall parts push that down to 50–100 ms — miss that window and you’re looking at misrun or cold shut. One thin-wall case with a 1230 mm flow length hit optimal fill at 41.1 ms, using 720°C melt temperature, 200°C mold temperature, and 50 m/s gate velocity.
Watch the far end of the cavity. Simulation data shows pressure drop peaks around 3.1 MPa in regions distant from the gate — that’s where flow hesitation, shrinkage porosity, and gas defects concentrate. Track velocity, pressure drop, and fill time together, not in isolation.
Step 8: Casting Trial Validation
Lab numbers only prove a filter works in a lab. Casting trial evaluation proves it works on your floor. Run a small-batch pour, then send sectioned castings for metallographic review. Adjust PPI up or down based on the inclusion levels you actually observe, because that feedback loop is what turns a lab pick into a production spec.
Record every batch with these fields:
– Pour time, filter preheat temp/duration, pour speed, ladle head height
– Batch/furnace/pour numbers, sample-to-casting ID mapping
– First-piece and last-piece results separately
– Defect log: cold shut, misrun, inclusions, porosity, cracks, surface roughness
– Scrap count, rework count, First Pass Yield (FPY)
Track inclusion count/size, Ra/Rz surface finish, pressure drop against baseline, and short-pour rate. One published trial found only 7 reworks out of 100 castings after filtration, with roughly 95% confidence in reduced weld-repair rates. That’s strong evidence for a purchasing decision.
If inclusions drop but short-pour rate climbs, roll back the spec. Lab and floor data must trend the same direction.
Step 9: Batch Consistency Verification (Batch-to-Batch Comparison)
One good batch proves nothing. Foundries get burned when they qualify a single sample, then bulk-order without checking whether that sample is the norm or the exception. Batch consistency verification is your defense against drift.
Run new batches against your retained reference sample. Use the same equipment, the same test method, the same inspection window. Compare dimensions, weight, strength, thermal resistance, and appearance side by side. For powder-based materials, add particle size distribution, chemical composition, oxide/impurity content, flowability, and bulk density to the checklist.
Watch for two failure signals: mean shift and increased variance. A filter that passes spec but drifts closer to the tolerance edge every batch is telling you something. Set an internal control band—historical average ± deviation—tighter than the official spec limit. If two consecutive batches move the same direction, isolate and retest before that material touches production.
Traceability Fields to Record
-
Batch ID, supplier lot/heat number, material grade
-
Production, arrival, and inspection dates
-
Key performance values and pass/fail result
-
Deviation notes and disposition (reject, rework, MRB release)
Without this, tracing a defect back to one bad heat number becomes guesswork.
Step 10: Supplier Documentation & Qualification Review
Paperwork gaps sink deals faster than failed tests. Before buying in bulk, get a complete documentation stack. You need a valid ISO 9001:2015 certificate, batch-level COA (with batch number, tested values, and inspector signature), SDS/MSDS for resin-coated products, and third-party reports on pore size, compressive strength, and thermal shock.
Sample trial terms to negotiate:
– 3–10 samples across production runs, 7–30 day evaluation window
– On-site technical support during trial pours
– Replacement samples or root-cause reports within 5–10 working days if performance fails
Protect yourself with contract language that requires AQL 0.65–2.5 inspection rights, 24–72 hour response windows for quality issues, and written approval before any material or process change. Score suppliers annually—quality 40%, delivery 25%, documentation 15%, responsiveness 10%, price 10%.
Conclusion
A single unqualified filter batch can cost you far more than the purchase price. Think scrapped castings, unplanned downtime, and a damaged reputation with your own customers. That’s the real stake behind every bulk order decision.
The ten-step framework replaces guesswork with data without adding bureaucracy to your procurement process. When you combine mesh opening consistency test results with thermal resistance testing and gas evolution data, you’re verifying performance with numbers that hold up under negotiation, audit, or dispute.
Pick your top three filter suppliers, run them through at least Steps 1 through 6 before your next bulk order, and document every result. Build your own qualification file. If you’d rather skip the learning curve, FoundryMax‘s lab team runs full qualification testing on customer samples, often within 48 hours.