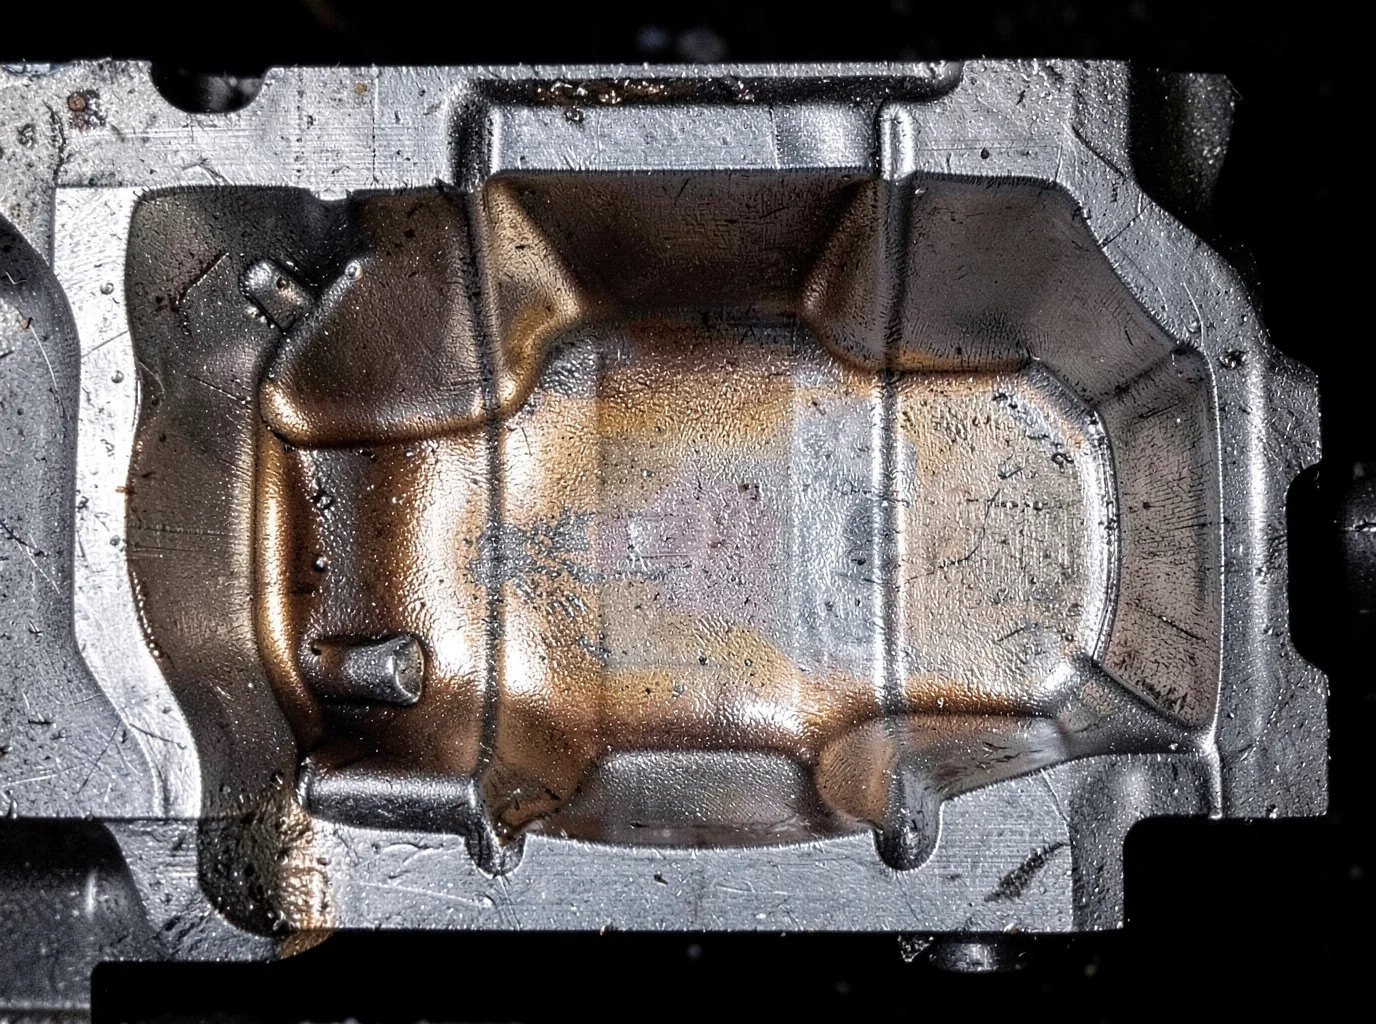
Every foundry engineer knows the sinking feeling when X-ray results show that cluster of shrinkage porosity in the exact same spot again. Your first instinct might be to blame the tooling, but most aluminum casting Shrinkage defects are process control problems disguised as mould design issues.
Before you price out new tooling or schedule a mould rebuild (and eat the lead time and capital expense that comes with it), check whether you have optimized everything upstream of the mould. Pouring temperature, melt cleanliness, degassing practice, filling velocity, and feeding geometry within your existing risers often drive more porosity variation than the cavity design itself.
This guide walks through a sequenced approach to reducing shrinkage porosity through process adjustments alone—no new tooling required—and covers how to verify each change worked before moving to the next.
Understanding Shrinkage Porosity: Causes and Diagnosis in Aluminum Castings
Aluminum alloys shrink 3.5–8.5% by volume during solidification, typically settling between 6–7%. That volume loss sets the baseline your feeding system must overcome on every pour.
Solidification proceeds unevenly from the outside in. The outer shell freezes first, driving the solidification front toward the center. As dendrites grow and interlock into a network, remaining liquid metal must force its way through narrowing interdendritic channels to feed that contraction. When those feed channels freeze shut—cutting off liquid metal from the gating system or riser—the last freezing zone suffers a localized pressure drop. That deficit forms shrinkage porosity.
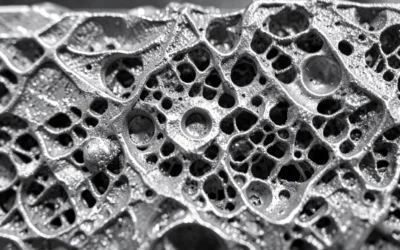
The defect usually appears as a cluster of interconnected interdendritic cavities rather than a single void. When feeding fails entirely across a localized section, a macro-shrinkage cavity opens directly inside the thermal hot spot.
Four variables control how much shrinkage porosity you end up with:
– Total solidification shrinkage of the alloy
– Freezing temperature range
– Solid fraction at final solidification
– Feeding distance and channel permeability
– Local solidification rate and temperature gradient
Shrinkage Porosity vs. Gas Porosity: Know the Difference
Not every pore visible on an X-ray stems from poor feeding. Liquid aluminum holds about 20 times more dissolved hydrogen than solid aluminum. As the freezing front advances, the solidifying metal pushes hydrogen into the remaining liquid and interdendritic spaces, where gas bubbles can nucleate independently of shrinkage.
|
Feature |
Shrinkage Porosity |
Gas Porosity |
|---|---|---|
|
Mechanism |
Unfed solidification shrinkage |
Hydrogen rejected during freezing |
|
Shape |
Irregular, angular, interconnected |
Round to near-spherical |
|
Microstructure |
Visible dendrite arms, jagged edges |
Smooth boundaries, no dendrite skeleton |
|
Hot zones |
Thick sections, hot spots, riser necks |
High-hydrogen, slow-cooling areas |
|
Detection limits |
X-ray can miss thin, film-like voids parallel to beam direction |
Small round pores may fall below resolution |
Where Shrinkage Porosity Shows Up
If repeat defects occur, evaluate these locations against casting geometry:
-
Thick walls and bosses: Long cooling paths create excessive feeding distance from the riser.
-
Thick-to-thin wall transitions: The thick section cools slower than adjacent thin walls, creating an isolated hot spot at the junction.
-
Rib-to-plate intersections: Concentrated metal volume slows down local heat extraction.
-
Hubs, flanges, bearing bosses: Heavy cylindrical sections remain prone to centerline or ring-shaped shrinkage.
-
Behind the gate or in sluggish flow zones: Metal stays hottest here, concentrating voids if feeding channels freeze first.
-
Undersized riser necks: The neck freezes before the riser finishes feeding, trapping a shrinkage cavity inside the hot spot.
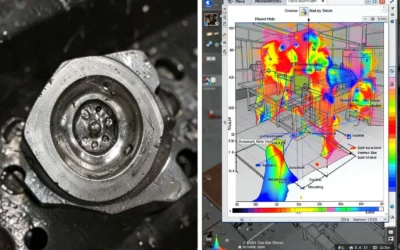
Compare defect locations against section thickness, geometric junctions, core designs, gate and riser positions, chill placement, and solidification simulation results. That cross-check separates an accurate diagnosis from guesswork.
The Composite Defect Nobody Talks About
A large share of aluminum casting porosity combines shrinkage and dissolved gas in a single defect. Solidification shrinkage first creates a microscopic pressure drop between dendrites. If the melt carries dissolved hydrogen, the gas diffuses into this existing cavity rather than nucleating on its own, because the void lowers the required activation energy. As feeding pressure drops further, the hydrogen bubble expands inside the shrinkage void, leaving a larger, irregular cavity than either mechanism would create on its own. Modest hydrogen levels can expand an existing shrinkage pore, producing an additive increase in total pore volume.
How to Confirm What You’re Actually Dealing With
-
Locate it: Use X-ray or industrial CT to verify whether voids cluster at thick sections, junctions, or thermal hot spots.
-
Check geometry in 3D: CT imaging reveals whether pores are dendritic, interconnected, and aligned with the last-to-freeze zone.
-
Cut and inspect: Section through the defect center and inspect the surface at 25–100x magnification. Rounded pores point to gas; angular, interdendritic contours indicate shrinkage.
-
Test the melt: Measure hydrogen content and audit degassing, metal transfer, and pouring practices to identify hydrogen pickup.
-
Correlate with process data: Match defect positions against filling simulations, solidification timing, riser feed behavior, chill performance, and local mold temperatures.
-
Classify composite defects correctly: If a void sits inside a hot spot and displays both dendritic arms and smooth bubble contours, treat it as shrinkage-dominant with gas-assisted growth instead of an isolated gas pore.
Step 1: Optimize Melt Temperature Control Without Mould Modification
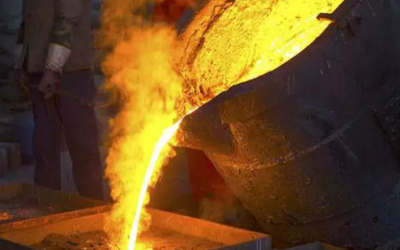
Pouring temperature decisions in aluminum casting make or break your porosity numbers before metal ever touches the gate. Get this wrong, and no amount of feeding and risering redesign will save the part.
The working window is 670–710°C for most 4xxx and A380 permanent-mould pours. Use the lowest temperature that still achieves complete fill and feed. Every degree of unnecessary superheat only adds hydrogen pickup and oxide formation.
The physics backs this up. Liquid aluminum at 800°C dissolves roughly 50% more hydrogen than at 660°C. During solidification, hydrogen solubility drops from about 0.65 mL/100g to 0.034 mL/100g, a 19-fold collapse. That rejected gas either escapes or turns into porosity. One casting study found minimum porosity at 710°C, with defects climbing sharply above 750°C.
Set-Point Adjustment Method
-
Start with a baseline of 690–700°C for common Al-Si alloys
-
Raise in 5–10°C increments only if cold shuts or incomplete filling appear
-
Drop in 5–10°C increments if porosity or dross increases
-
Treat 710°C as your upper limit before requiring documented justification
Measure at the furnace, ladle, and pouring point separately. Target ±5–10°C consistency between the set point and actual pour temperature—drift here is often where shrinkage porosity creeps back in.
Step 2: Remove Dissolved Hydrogen Through Melt Treatment
Temperature control gets you only halfway. The hydrogen already dissolved in your melt needs an exit route, and rotary degassing provides it.
Sequence matters. Degas after alloy additions, temperature adjustment, and skimming, never before. The correct order runs: melt → alloy treatment → temperature stabilization → rotary degassing → RPT verification → cover/protect → pour promptly. If you skip a step or reorder the process, you reintroduce the hydrogen you just removed.
Set Your Rotary Degassing Parameters
For a 500–1,000 kg melt, run these settings:
– Rotor speed: 300–500 rpm
– Inert gas flow: 10–25 L/min
– Bath temperature: 680–700°C
– Treatment time: minimum 15 minutes, typically 10–20 minutes depending on melt mass and starting hydrogen level
Choose argon when melt cleanliness is non-negotiable; nitrogen works fine for standard alloys at lower cost. Either way, use dry gas, as moisture in the line defeats the purpose.
Submerge the rotor fully, start gas flow during immersion, and keep bubble dispersion fine. Heavy surface rolling pulls oxide film into the melt and creates a second source of porosity.
Verify With Reduced Pressure Testing (RPT)
Measure the melt directly. Pull a 100–200 g sample into a preheated cup, apply a 60–80 mbar vacuum, and hold it for at least 7 minutes. Compare density against an atmospheric sample. A properly run degassing cycle cuts hydrogen-related porosity by 50–70% within 15–20 minutes.
Step 3: Improve Melt Filtration and Cleanliness in Existing Gating System
Oxide films block the interdendritic channels that feed shrinkage. As dendrites interlock during solidification, remaining liquid must squeeze through narrowing gaps. Oxide skins, non-metallic inclusions, and iron-rich intermetallics like β-Al₅FeSi plates lodge in those gaps, choking off feeding before it can compensate for shrinkage. Oxides also give dissolved hydrogen a surface to nucleate on, meaning a dirty melt pairs shrinkage porosity with gas porosity in the exact same defect.
Filter Selection Without Touching Your Tooling
You can retrofit filtration into your existing Gating System without buying new pattern equipment.
|
Filter |
Pore Size |
Relative Flow |
Filtration Efficiency (≥20 μm) |
Best Use |
|---|---|---|---|---|
|
10 PPI |
4.0–5.0 mm |
Very High |
60–70% |
Large-volume, ingot/billet |
|
20 PPI |
2.0–3.0 mm |
High |
75–85% |
General sand casting |
|
30 PPI |
1.2–1.8 mm |
Medium-High |
85–92% |
Gravity casting, A356, wheels |
|
40 PPI |
0.8–1.2 mm |
Medium |
90–95% |
Low-pressure, critical parts |
Start at 20–30 PPI for standard Al-Si castings, and step up to 30–40 PPI for oxide-sensitive parts like automotive wheels. A 30 PPI filter needs 100–150 mm of metal head above it to flow consistently. Undersize it and it clogs early; oversize it and you waste gating volume.
Placement Rules That Matter
-
Install near the end of the runner, close to the ingate but not touching the cavity, making it the last filtration point before fill.
-
For gravity and low-pressure casting, mount filters horizontally so metal passes evenly across the full face.
-
Never place a filter at the base of the sprue or in a high-velocity section, or you will get jetting, pressure drop, and secondary turbulence instead of clean flow.
-
Seal the filter tight against its seat. Any gap creates a bypass channel for unfiltered metal.
-
Expand the runner cross-section immediately after the filter to slow exit velocity and prevent re-oxidation.
Skimming and Transfer Discipline
Filtration cannot fix dirty transfer practices upstream.
-
Let the melt surface go still before skimming: no stirring, and no topping off mid-skim.
-
Use a dry, preheated flat skimmer. Enter at a low angle, push dross toward the wall in one motion, and lift it out clean. Avoid raking the surface.
-
Draw metal away from the center and visible dross zones.
-
Lower pour height and keep the stream narrow and continuous to avoid splashing fill into the sprue.
-
Use a pouring basin with a dam or weir so floating dross stays trapped before reaching the filter.
Run this sequence: still-melt skimming → controlled transfer → 20–40 PPI filtration → low-velocity flow after the filter. Raising filter PPI without fixing dross control upstream only adds pressure drop without stopping secondary oxidation or gas entrainment.
Step 4: Optimize Filling Process to Reduce Turbulence
A choppy metal stream causes severe internal defects. Turbulent filling folds oxide film into the melt, traps air, and seeds porosity before solidification begins.
Ladle handling matters first. Keep the pour spout close to the sprue or shot sleeve inlet. Short, continuous streams beat high free-fall drops every time. Direct the metal tangentially along the wall rather than dropping it directly onto the base. Pour right after transfer; sitting melt loses heat, forms a thicker oxide skin, and resists smooth flow.
Pour rate should ramp, not spike. Start slow to establish a stable pool, then increase volume once the inlet is covered. Avoid stop-start pouring, as intermittent flow churns the surface and drags air into the melt.
HPDC Shot Sleeve and Shot Speed Control
In die casting, shot sleeve fill ratios run 30–60%. Below 30%, the advancing wave breaks unpredictably. Above 60%, usable shot stroke drops significantly.
|
Phase |
Speed |
Purpose |
|---|---|---|
|
Slow shot |
0.15–0.50 m/s |
Advance metal wave steadily without splashing |
|
Fast shot |
2–6 m/s |
Fill before solidification without excess gas entrainment |
Fill time runs between 20–100 ms, depending on wall thickness, alloy choice, gate section, and die temperature.
Shot transition timing is critical. Switch too early, before the wave stabilizes, and metal splashes while trapping air. Switch too late and the casting develops cold shuts from underfill. Set the transition point once metal approaches the gate, or around 30–50% sleeve fill. Confirm this point using position, velocity, and pressure curves together rather than relying on a fixed timer. Adjust only one variable per trial.
Intensification Pressure Without Over-Pressurizing
Standard intensification ranges run 60–120 MPa. Start around 60 MPa for general castings, and push toward 80–120 MPa for pressure-tight or structural parts. ADC12 trials showed clear porosity reductions between 60–85 MPa.
Timing matters more than peak pressure. Build intensification while the cavity is nearly full and the gate remains open, using a 10–50 ms rise time. Pressurizing too early disrupts fill; waiting too long fails to feed shrinkage. Maintain pressure until the gate solidifies. Pumping pressure after that point strains the machine without recovering any remaining porosity.
In one documented production trial, synchronizing intensification timing cut porosity from ~3 vol% to under 0.5 vol% without modifying the tooling.
Step 5: Enhance Feeding Effectiveness Using Existing Risers and Tooling
Your existing risers likely have more feeding capacity than you are using. Before cutting new tooling, get more out of your riser sleeves, modulus calculations, and chill placement—three adjustments that work within your current mould.
Riser Sleeve Selection
Test insulating and exothermic sleeve combinations before enlarging any riser. In one 7-inch riser trial, exothermic sleeves extended time-to-solidus by 44% over a bare riser, while insulating sleeves extended it by 55%. Sleeve thickness, coverage, and riser geometry all shift performance, so screen both options through trials or simulation. Check the sleeve-to-riser gap, top coverage, neck heat loss, and base contact. The riser must solidify after the section it feeds, targeting Mr ≈ 1.2Mc.
Apply Modulus Calculations to Your Current Risers
Modulus (M = V/A) identifies which zones run hot. Divide the casting into thick walls, bosses, and junctions, calculate each M_c, and compare the result against the existing riser modulus. Feeding efficiency for a well-designed sleeved riser runs 0.25–0.35, compared to roughly 0.14 for bare risers. Use these values to confirm that your riser volume covers the 10–20% shrinkage allowance.
Chill Placement Without Tooling Changes
Position chills next to thick sections and fillets without blocking feed paths. In aluminum housing cases, internal chills placed in post-machined zones like valve bores outperformed external chills exposed to metal wash. Compare X-rays of chilled and unchilled trials, then section the highest-risk area to confirm shrinkage stays inside the riser.
Step 6: Control Cooling Rate and Mould Thermal Balance
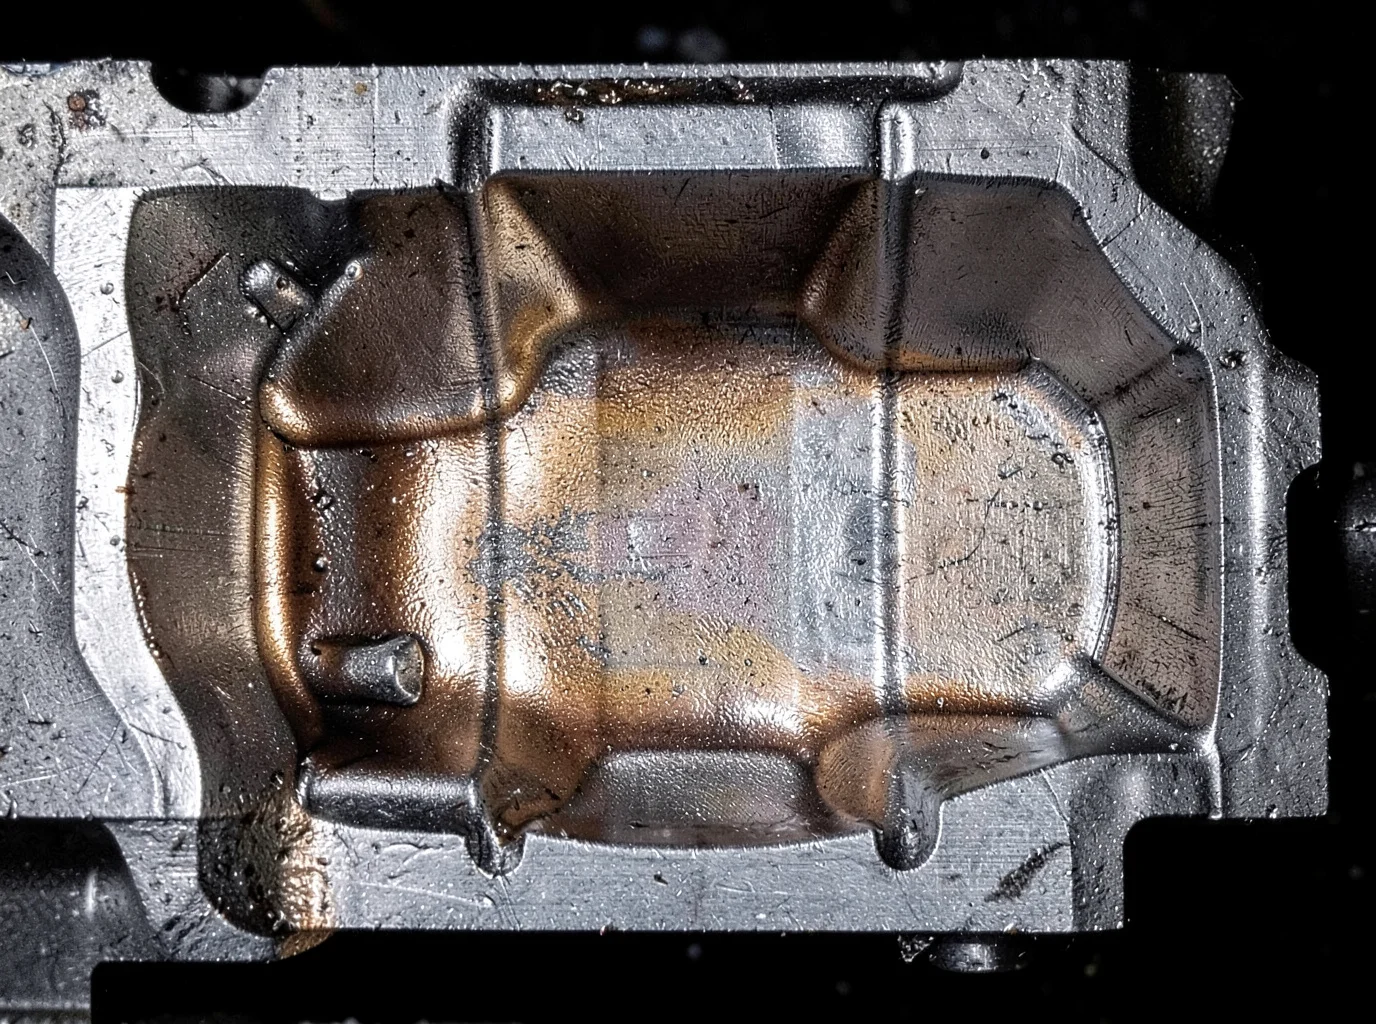
Shrinkage porosity often happens when a mould cools evenly across every section. Sound feeding requires directional thermal gradients.
Build a Directional Thermal Gradient
Use your modulus map (M = V/A) to confirm which zones freeze last, then cool those sections harder than the metal feeding them. External chills can extend feeding distance by about 50%, while Exothermic sleeves or riser compounds add another 20–40%. Aim for a thermal gradient around 0.5 K/mm for sand-cast steel and closer to 2 K/mm for aluminum sand castings, then verify the values against simulations and trial parts.
Prevent Premature Channel Closure
Place chills at the far end of a hot spot rather than running them along the feed path. Overcooling the feed channel seals it before the riser finishes feeding, which moves the defect deeper into the casting instead of eliminating it.
Maintain Cycle-to-Cycle Thermal Balance
Log inlet temperature, outlet temperature, flow rate, and pressure drop for each cooling circuit across thick-wall, thin-wall, and riser zones. Control each zone on its own instead of adjusting a single global coolant temperature. A rising outlet temperature or a drop in flow points to restricted or fouled lines, which quickly brings back the hot spots you already resolved.
Step 7: Verify Mould and Core Condition for Consistent Results
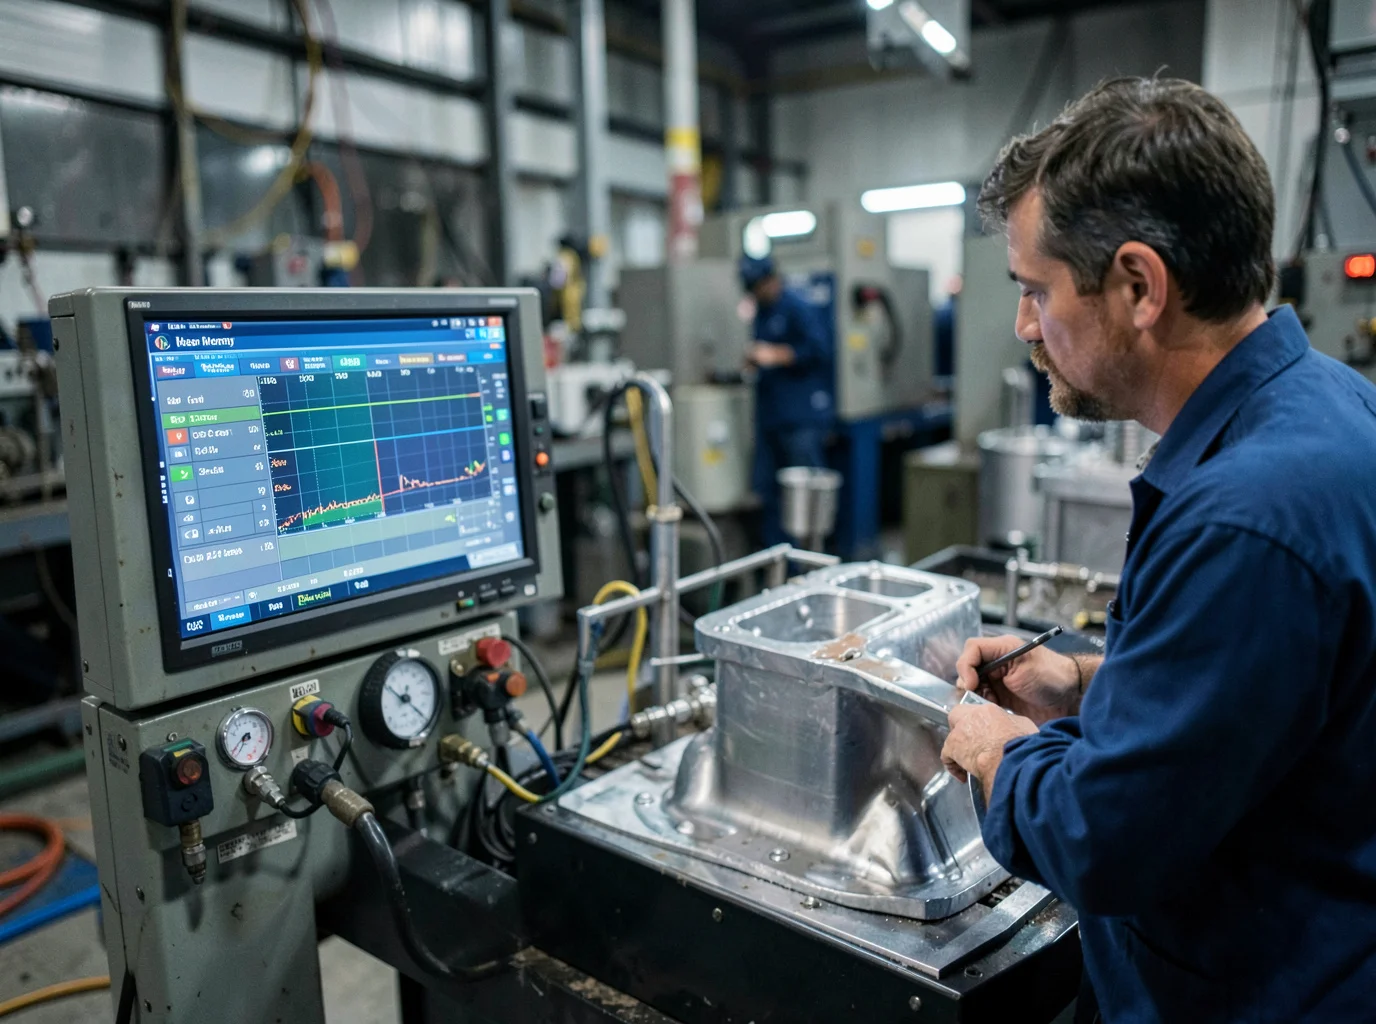
Even an optimized melt will not save you if your core sand is damp or your vents are clogged with residue. This step connects process control with tooling readiness without touching the cavity design.
Confirm Core Strength and Cure Before Pouring
For every batch, record immediate tensile strength, cure speed, sand density, permeability, hot strength, delayed tensile strength, and moisture resistance. After coating, run a dip-and-redry tensile test by dipping cores at production baumé and drying them in a lab oven at 121°C for about 2 hours to confirm a full cure. Whitish, tacky, or soft patches point to trapped moisture or uneven compaction. Undercompacted zones absorb more coating and dry slower, which feeds gas porosity downstream.
Check Existing Venting Channels for Blockage
Clear every vent hole, core print vent, parting-line channel, and overflow with low-pressure air. Keep “pinhole” vents 25–50 mm from the casting surface to prevent direct penetration. As an engineering benchmark, total vent cross-section should match your gating system’s minimum choke area, scaling 1.5–2.5x for thin-wall or complex parts. Confirm vent pins retract and channels run clear before mould close.
Diagnostic Tools and Verification Methods for Porosity Reduction
You have four main methods to verify porosity, and each one tells you something different. Picking the wrong test wastes money or gives you false confidence.
|
Method |
Quantifiable Output |
Best Use Case |
Limitations & Cost |
|---|---|---|---|
|
RPT / Density Index |
Pore grade, sample density, DI trend |
Fast melt release before pour; batch-to-batch comparison |
Low cost and takes minutes, but sample results do not match final part porosity. Keep vacuum levels and sample sizes fixed, because pulling too much vacuum inflates pore readings and overstates scrap rates. |
|
2D X-ray |
Pore location, equivalent diameter, defect count |
High-volume inline or sampling inspection |
Resolution runs ~5–6% of wall thickness, leaving ~0.5 mm defects near the detection floor. Targets around ~0.2 mm require step-wedge verification. |
|
Industrial CT/XCT |
3D pore volume, max size, connectivity, void fraction |
First-article approval, failure analysis, critical structural zones |
Voxel size spans 50–200 μm, with sub-10 μm resolution possible for microporosity. Detects spherical defects down to ~15 μm and flake defects to ~30 μm. Highest accuracy, highest cost. |
|
Metallography |
Area pore fraction, max pore diameter, roundness |
CT calibration, process validation, defect mechanism study |
Destructive and limited to a single plane. A 2D section frequently underestimates connected 3D porosity. |
Recommended pairing: Screen melt with RPT/DI during production, inspect finished parts with X-ray, and reserve CT to correlate process settings with true 3D porosity on new tooling or high-value castings.
Track These Metrics Every Batch
-
Max pore diameter (D_max) and equivalent spherical diameter
-
Pore volume fraction (φv = Vp/V_ROI × 100%), with ROI size documented
-
Connectivity index, which predicts leak failures far better than raw pore count
-
Scrap rate, categorized by oversize defects, mislocation, and leak test failures
Build a Three-Tier Action System
-
Warning line: any metric reaches 70–80% of spec limit → increase sampling frequency
-
Action line: two consecutive batches hit the warning line → freeze parameter changes, then audit melt quality and gating
-
Reject line: D_max, void fraction, or leak results exceed drawing limits
Run Controlled Trials, Not Guesswork
Change one variable at a time—such as degassing duration—while holding melt temperature, mould temperature, pour speed, and filter selection steady. Run at least 3 repeat heats for every condition, randomize the trial sequence to cancel process drift, and lock in your CT or sectioning locations so the data stays directly comparable. Never treat RPT as final part verification; correlate it against X-ray, CT, or pressure-decay leak data before relying on it on the floor.
Recommended 8-Step Trial Sequence for Foundries
A sequenced trial plan fixes porosity where random adjustments fail. Work through these eight steps in order, and you will isolate which variable moved the needle instead of guessing.
|
Step |
Focus |
Key Target |
|---|---|---|
|
1 |
Baseline |
20 castings minimum, current recipe, full defect Pareto |
|
2 |
Define CTQs |
Defect rate, hydrogen level, inclusion count, yield |
|
3 |
Lock melt prep |
Fixed chemistry, charge ratio, holding time |
|
4 |
Trial degassing |
Example: 600s at 450 rpm, argon at 10 L/min |
|
5 |
Add filtration |
Minimum 3 repeat heats per combination |
|
6 |
Adjust pouring parameters |
Example DOE: 1430°C, 20s pour time |
|
7 |
Optimize cooling/feeding |
2–4 chill variants against confirmed hot spots |
|
8 |
Confirm and validate |
3 confirmation trials, then one production lot |
A realistic timeline runs 2–5 production days. Day 1 covers baseline and matrix setup, while Days 2–3 handle degassing, filtration, and pouring trials. Day 4 tests local cooling, and Day 5 confirms the winning combination.
Sequence order matters. Degas first, because gas defects mask everything downstream. Filter second to stabilize cleanliness before changing fill conditions. Adjust pouring temperature third; one study tested 700°C, 720°C, and 740°C against degassed versus non-degassed melt. Move to chill placement only after those steps, since solidification changes cannot be judged while porosity still fluctuates from upstream variables.
Scoring and Acceptance Gates
Rank each trial combination with a weighted score:
Score = 0.40(defect reduction) + 0.25(NDT quality) + 0.15(mechanical properties) + 0.10(yield) + 0.10(cycle time)
Set acceptance gates before you start:
-
Defect rate below baseline, with no new critical defect mode
-
Lower X-ray/CT indication area and inclusion count than baseline
-
Temperature, fill time, and hydrogen/density index inside the approved window
-
At least three confirmation trials at the proposed optimum—judge by mean and standard deviation, never a single good casting
-
One normal production lot confirming the ranking without operator intervention
Use ANOVA to confirm which factors drove the improvement, not just correlation. One published gearbox-housing case ran this exact sequence and cut an initial 7% sand-related rejection rate after optimization and confirmation trials.
Expected Outcomes: What Process Changes Can and Cannot Fix
Degassing alone has a ceiling. It drops dissolved hydrogen toward <0.10–0.15 mL H₂/100g Al and eliminates pinhole porosity, but it won’t fix an undersized riser, a dead hot spot, or wrong-direction solidification. Feeding problems stay feeding problems regardless of the hydrogen level.
Real gains come when four controls work together: low-hydrogen melt, non-turbulent filling, directional solidification, and sustained feeding pressure. Foundries running all four report scrap dropping from 10–25% down to 0.5–4%. One HPDC operation cut rejects from 25% to 0.5% after fixing shot speed, overflow, and core cooling. Another program brought shrinkage porosity down from 20% to 2%, proving process control closes most gaps.
Conclusion
Shrinkage porosity rarely has a single root cause, which is good news. Melt temperature control, proper degassing, and smarter feeding design tackle most porosity issues without touching your tooling budget. The real gains come when you treat gating and risering as process levers rather than fixed variables.
If you want to reduce shrinkage porosity in aluminum castings without changing your mould, run the 8-step trial sequence, verify results with X-ray or density testing, and track your scrap rate before and after each change. Isolate variables, measure, and iterate instead of trying to fix everything at once.
The foundries that win on quality squeeze every bit of performance out of the tooling they already have. Start your trial run this week, and let your yield rate show if it’s working.