You cut the casting open to find a cluster of dark, round voids staring back at you. Whether it’s gas porosity or shrinkage, the part fails inspection either way. The fixes couldn’t be more different, though, and guessing wrong means chasing the wrong root cause for weeks while scrap rates climb.
Under bad light or during a rushed inspection, these defects can look remarkably similar on a cut section. Yet their root mechanisms are completely different. One traces back to dissolved gas escaping during solidification; the other occurs when metal runs out of liquid feed before it finishes shrinking. Shape, distribution, surface texture, and edge definition tell the full story if you know what to look for.
This guide shows how to read those fingerprints, with a side-by-side identification table, real cut-section comparisons, and field-ready decision logic you can apply right at the bench without a lab.
Gas Porosity: Formation Mechanism & Root Causes
Hydrogen causes most gas porosity, driven by a simple physical shift. Molten aluminum at 660°C holds 0.67–0.77 mL of hydrogen per 100 grams. Once it solidifies, that capacity drops more than tenfold to around 0.035 mL per 100 grams. The rejected hydrogen cannot stay in solution, so it forms gas bubbles.
Higher temperatures make the problem worse. Below 1000°C, every 100°C increase doubles hydrogen solubility in liquid aluminum. Holding a melt too hot for too long forces it to absorb gas that it must dump during cooling.
Most of this hydrogen comes from water. Wet charge material, damp tools, and moisture on cores or mold surfaces react with the molten metal, feeding hydrogen directly into the melt.
Precipitation occurs during solidification. As the metal cools and solubility drops, hydrogen atoms pair into gas molecules that nucleate along oxide films, inclusions, and interdendritic spaces. These bubbles expand in the remaining liquid pools, clustering in last-solidifying zones, between dendrite arms, and near the casting’s thermal center. High hydrogen levels, elevated pouring temperatures, and slow cooling drive up pore count and pore size. Conversely, rapid solidification and steep thermal gradients freeze the metal fast enough to limit bubble growth.
Turbulent Entrainment: The Other Gas Source
Dissolved hydrogen is not the only source; mechanical air entrapment is just as common in poor gating systems. Broken pour streams, excessive free-fall heights, sharp turns, sudden section changes, and fast fill speeds pull air directly into the flow. Oxide skins wrap these air pockets almost instantly, giving them little time to float free before the metal freezes. Solving this requires mechanical fixes: design short, smooth, continuous runners that prevent turbulence from developing.
Four Root Causes Worth Checking First
Insufficient melt degassing
– Skipping rotary argon or nitrogen degassing, or running rotors at improper depth, gas flow, and cycle times
– Holding molten metal at high temperatures too long, which accelerates hydrogen pickup and oxide formation
– Introducing moisture through wet charge, damp return scrap, crucibles, or skimming tools
– Exceeding the hydrogen limits of the alloy and wall section, triggering diffuse porosity and fine pinholes during freeze
Excess moisture in cores, molds, or sand
– Damp green sand, undercured cores, cold tooling, and residual moisture that generate steam and hydrogen on contact with liquid metal
– Incompletely dried water-based washes, inadequate mold preheating, or plugged core vents that trap steam in the cavity
– Typical locations: around core prints, deep pockets, blind cavities, thick walls, and poorly vented sections
Gating system turbulence – Direct sprue impingement, shallow pouring basins, high ingate velocities, sharp geometry changes, and unguided free falls – Defects appear as scattered round voids, oxide-wrapped air pockets, near-surface blisters, and dense radiographic indications – Corrections include bottom gating, deeper pour basins, generous fillet radii, properly sized vents and overflows, and runner layouts that prevent converging streams from folding over
Binder, coating, and organic off-gassing
– Core binders, resin-bonded sands, solvent carriers, die lubricants, and organic residues breaking down under heat into steam, hydrogen, CO, CO₂, and volatile gases
– Excessive binder additions, heavy wash coats, poor bake-out, and low sand permeability that drive up mold cavity pressure
– Corrections include reducing binder and coating thicknesses, selecting low-gas binder systems, baking cores thoroughly, and expanding vent passages
How Porosity Shows Up Across Processes
|
Process |
Primary Gas Source |
Typical Appearance & Location |
|---|---|---|
|
Sand casting |
Sand and core moisture, binder off-gassing, inadequate venting, pour turbulence, and rejected hydrogen |
Broad range of pore sizes; frequent near cores, heavy sections, cope surfaces, and dead pockets; often found alongside sand inclusions and oxide films |
|
Die casting |
Air entrained during high-velocity injection, poor shot-sleeve and cavity venting, lube decomposition, dissolved hydrogen, and folded oxide skins |
Fine, dispersed, or blister-like internal voids clustered at end-of-fill areas, wall transitions, and overflows; leads to pressure leaks, heat-treat blisters, and low fatigue life, often overlapping with shrinkage |
|
Aluminum casting |
Dissolved hydrogen driven out by the steep solubility drop during freezing, compounded by air entrainment and volumetric shrinkage |
Smooth round or oval pores along the solidification front and dendrite arms; elevated melt hydrogen, high pour temperatures, and slow cooling increase total void volume and pore size |
Round, smooth-walled pores distributed across a section indicate dissolved hydrogen. Irregular, angular voids that trail into dendrite arms point to combined gas and Shrinkage defects rather than simple gas porosity. In aluminum foundries, degassing will not solve the issue if turbulent gating or damp tooling continuously introduces gas into the cavity. Diagnose all four root causes together.
Shrinkage Cavity/Porosity: Formation Mechanism & Root Causes
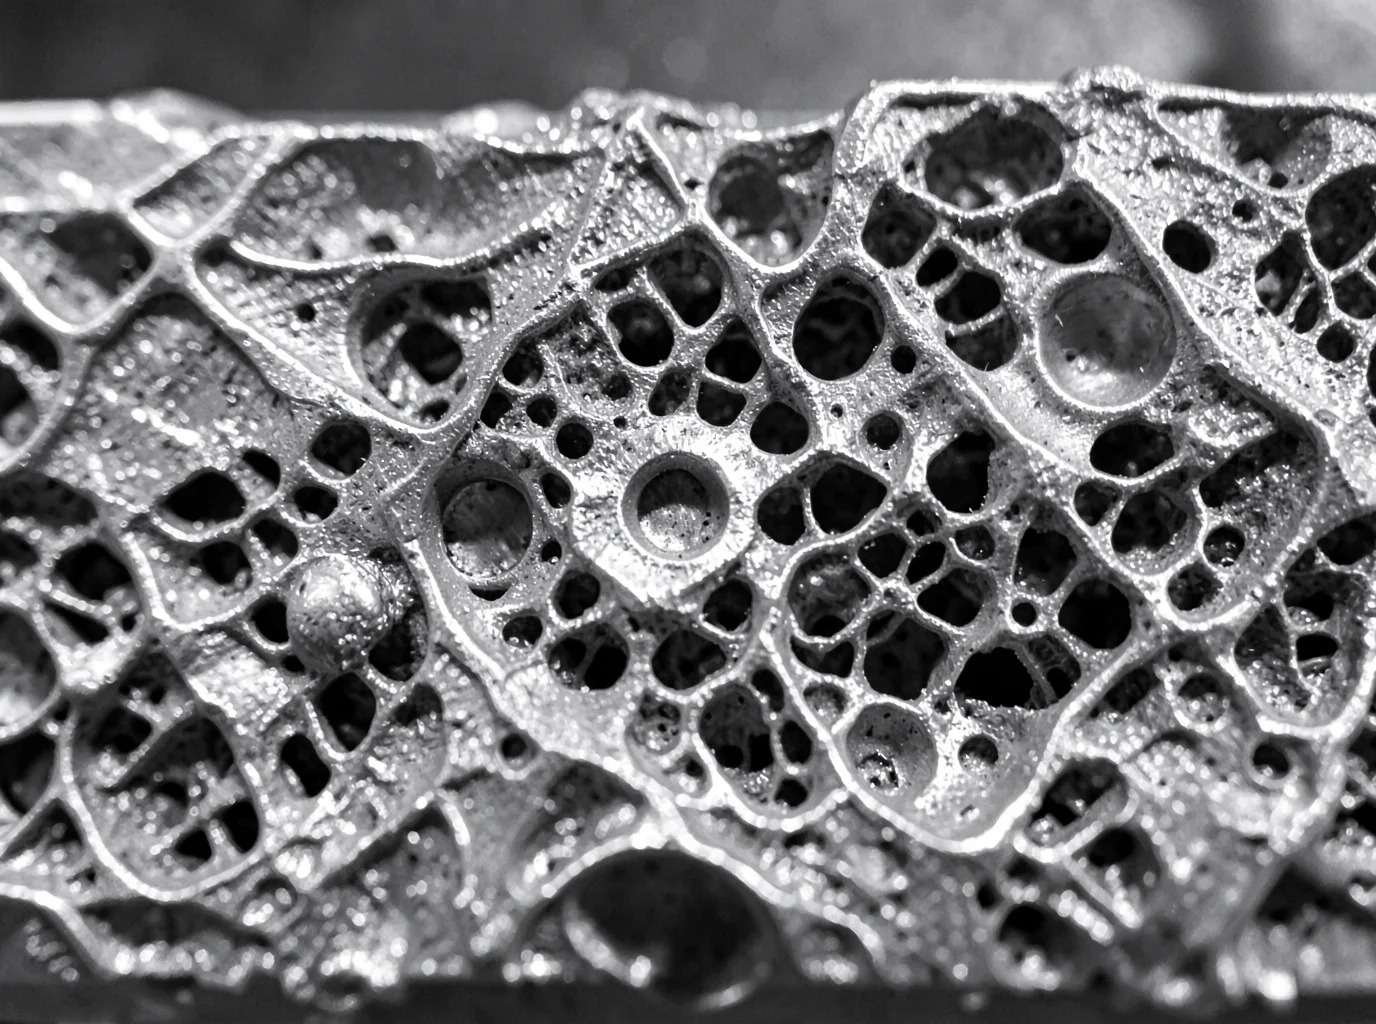
Metal shrinks in three distinct stages, and each stage determines where a void develops.
Liquid shrinkage happens first. As molten metal cools toward its liquidus, density climbs, volume drops, and the liquid surface sinks unless a gate or riser continues feeding it. Solidification shrinkage follows, and it creates the bulk of the deficit. Liquid transforming into denser solid drives this volume loss. If upstream liquid metal cannot supply that volume, you get a shrinkage cavity or shrinkage porosity. Dissolved gas is not required; volumetric contraction alone causes the void.
Feeding Path Failure
risers in casting are supposed to stay liquid and feed the last-solidifying zones, but that feed path breaks down once dendrites interlock. Early in solidification, liquid and dendrites shift easily, absorbing part of the volume loss. Once the solid fraction climbs, dendrites lock into a semi-solid skeleton. Feeding then drops from open liquid flow to restricted seepage between dendrites. As permeability drops and flow resistance rises, pressure losses mount. Hot spots maintain a lower solid fraction longer, making them the first locations where shrinkage voids nucleate.
Pressure plays a direct role here as well. Mushy-zone feeding drops local pressure, which lowers gas solubility in the remaining liquid. Shrinkage porosity and gas-driven porosity frequently develop side by side in the same pocket, even though shrinkage alone can form voids without any gas present.
Geometry-Driven Hot Spots
Four geometric culprits show up repeatedly in casting defect analysis:
-
Thick sections, isolated bosses, flanges, hubs, and large fillets: Slow cooling means they solidify last, forming internal shrinkage cores.
-
Wall thickness transitions: Thin walls freeze first and can sever the feeding path to adjacent thick sections, creating shrinkage porosity right at the junction.
-
Rib intersections: T-shapes, cross-ribs, and multi-rib junctions concentrate metal locally, forming hidden hot spots that require thickness reduction or chills.
-
Sharp internal fillets and section transitions: Abrupt section changes raise local modulus and break the continuity of the solidification front, concentrating shrinkage on inside corners.
Gating and Riser Design Failures
Riser systems fail in five predictable ways:
-
The riser sits too far from the hot spot, creating excessive feeding pressure loss.
-
The riser solidifies before the casting does, cutting off feed metal.
-
Riser volume or modulus is undersized for the feed demand.
-
The gate or riser neck overlaps the hot spot, creating a new local hot spot.
-
Metal fails to flow far-to-near toward the riser, allowing the hot spot to seal off early.
Sound directional solidification routes metal from thin sections to thick sections to the riser. It keeps risers close to the last-solidifying zone without enlarging the hot spot at the neck, and applies chills, pads, or relocated ingates on isolated hot spots. Uniform wall thickness prevents non-functional metal buildup altogether. Gray and Ductile Iron are partial exceptions because graphite expansion provides some self-feeding, but gating and risering must still work in tandem with that expansion rather than relying on sizing formulas meant for steel.
Short vs. Long Freezing Range Alloys
|
Solidification Type |
Mushy Zone Behavior |
Typical Shrinkage Shape |
Main Location |
|---|---|---|---|
|
Short freezing range alloys |
Narrow two-phase zone; solidification front stays concentrated; liquid feeding path closes off fast |
Concentrated, larger internal shrinkage cavity or centerline shrinkage; often a closed void |
Center of thick walls, inside hot spots, last-to-freeze zones |
|
Long freezing range alloys |
Wide mushy zone; dendrite network builds gradually; feeding has to push through a long semi-solid stretch |
Dispersed, fine, interconnected micro shrinkage; sometimes surface sink or open shrinkage cavity |
Near-surface, interdendritic regions, long mushy-zone stretches near hot spots |
Long freezing range alloys tend to develop surface sink marks or open shrinkage defects, whereas short freezing range alloys typically form internal porosity. Short freezing range alloys depend heavily on the exact location of the thermal center, so placing a riser directly over that hot spot usually solves the problem. Long freezing range alloys spread the deficit across a wider area. Even without a single large cavity, low mushy-zone permeability can trigger widespread micro shrinkage, which demands stronger directional solidification, shorter feeding distances, and well-matched chill-and-riser layouts.
Shrinkage risk depends on how three numbers balance out: solidification shrinkage volume, available liquid metal supply, and the mushy zone’s permeability during the final stage of freeze.
Visual Identification Table: Shape, Surface & Edge Characteristics
You can identify most defects long before sending parts to a lab if you evaluate three physical traits: shape, surface texture, and edge sharpness. Work through them in that order, and you will separate gas porosity from shrinkage cavities on a cut section most of the time.
|
Feature |
Gas Porosity |
Shrinkage Cavity/Porosity |
Field Check |
|---|---|---|---|
|
2D Shape |
Round, near-spherical, or oval. Surface tension at the gas-metal interface keeps the boundary regular. |
Irregular, elongated, angular, or branched, turning sponge-like when connected. |
Round and isolated points to gas; irregular and connected points to shrinkage. |
|
Cavity Wall/Surface |
Smooth, often bright metallic, with an occasional oxide tint or dark film. |
Rough and dull, showing dendrite remnants and tear marks. |
Inspect wall continuity rather than pore size alone. |
|
Edge Definition |
Smooth, closed, and evenly curved. |
Jagged, burr-like, or dendritic, often with open ends. |
A low-power scope on the boundary settles most disputes. |
|
Distribution |
Isolated or in uniform clusters, frequently near surfaces or gas-trap zones. |
Concentrated in thick sections, hot spots, and last-to-freeze zones. |
Cross-reference the location against wall thickness and riser layout. |
|
Size/Visibility |
Ranges from pinholes to large round pores; pinholes frequently show up during machining. |
Ranges from open macro cavities down to microscopic shrinkage; defects above 0.5 mm are visible to the naked eye. |
Size alone never confirms defect type. |
|
Macro Risk Pattern |
Single smooth sphere or uniform small-pore cluster. |
Large irregular cavity, tubular shrinkage, dendritic network, or sponge zone. |
Comparing a smooth sphere against a dendritic sponge provides the clearest distinction. |
Four Reference Cases Worth Memorizing
Case A: Isolated gas pore – Near-circular with a continuous smooth wall, uniform diameter, and no dendritic attachment. Caption: “Isolated spherical gas pore—smooth, rounded, closed contour.”
Case B: Dendritic shrinkage – A main cavity with thin branches, jagged edges, and voids running along interdendritic gaps. Caption: “Interdendritic shrinkage—branched, irregular, rough cavity.”
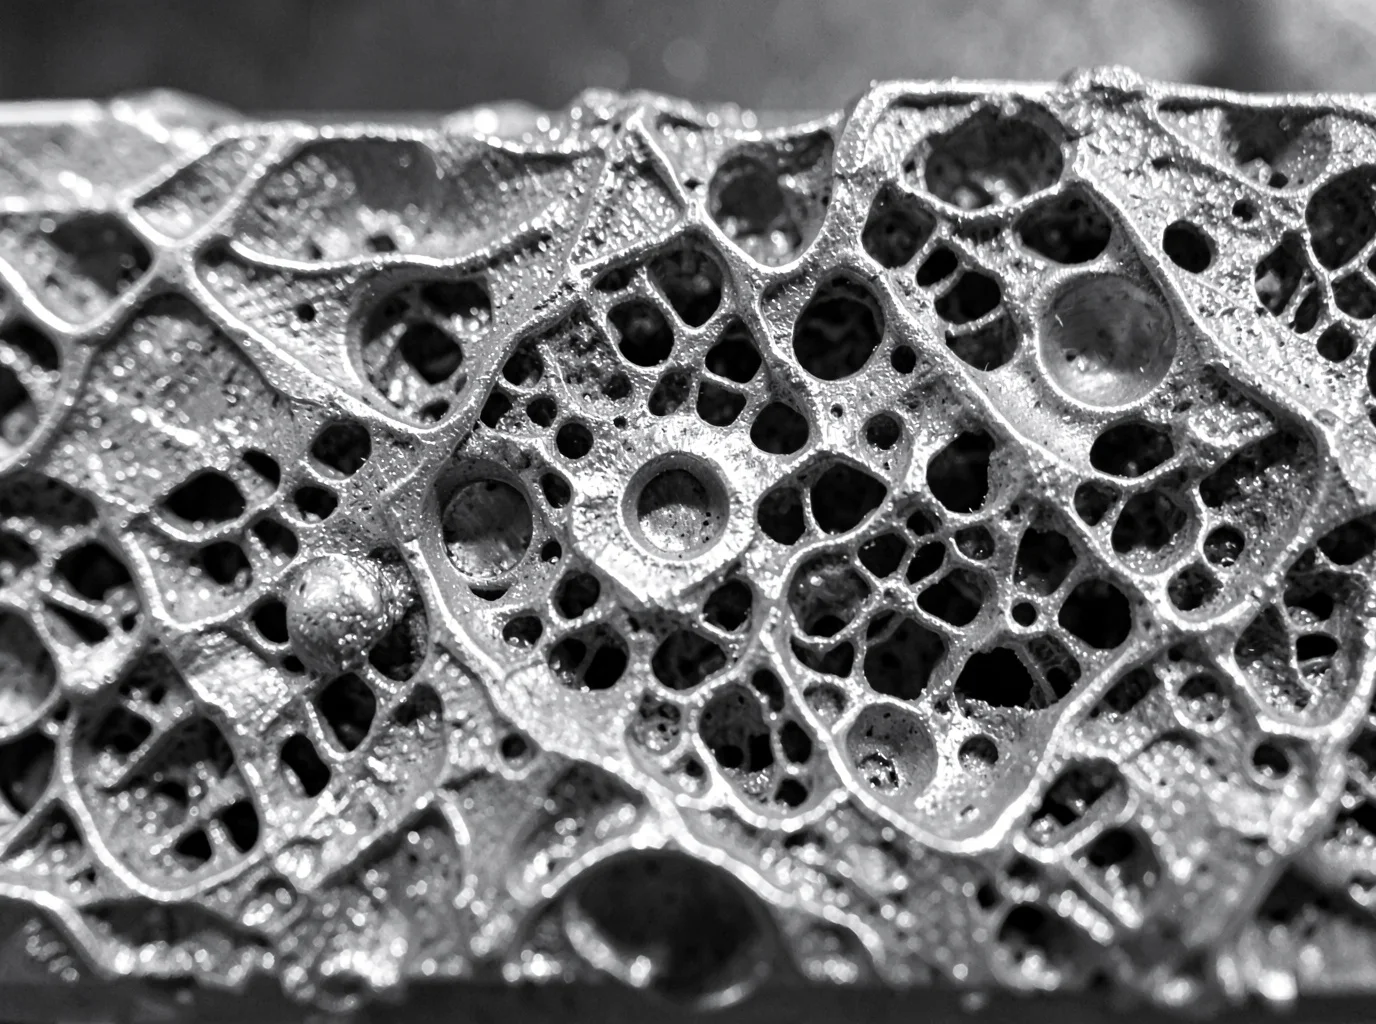
Case C: Sponge-like micro shrinkage – Dense, interconnected pore clusters in thick sections or hot spots. Fatigue cracks often start in these zones. Caption: “Sponge-like shrinkage cluster surrounded by interdendritic microporosity.”
Case D: Mixed defect – An irregular shrinkage cavity surrounded by round, locally connected gas pores. Avoid forcing a single label, as gas and shrinkage often occur together.
Microscopic Confirmation
Under magnification, interdendritic shrinkage reveals a network broken apart by the dendrite skeleton, rough walls, tear marks at the solid-liquid front, and strings of connected microvoids. Gas pores sit independently of dendrites, keep a smooth, near-spherical boundary, and contain no solid fill. Shrinkage creates continuous weak paths that drive crack growth, while gas pores act as isolated stress risers that become dangerous once they grow large.
Quick decision rule: round, smooth, and closed features point to gas. Irregular, rough, and dendritic or sponge patterns point to shrinkage. When you see both together, treat the flaw as a composite defect and confirm it with metallography.
Distribution Pattern Analysis: Where Defects Typically Appear
Location tells you almost as much as shape does. Map where a defect sits on the cut section, and you narrow the diagnosis before checking edge sharpness.
Where Gas Porosity Clusters
Gas porosity concentrates in three zones. Near-surface areas, particularly upper faces, cope surfaces, and poorly vented sections, trap rising gas before it escapes the melt. Gating pathways follow. Sprues, runners, ingates, and the metal immediately downstream show porosity strung along flow lines whenever turbulence, splashing, or jet impingement draws in air. Turbulent spots round out the pattern, including sharp bends, impact walls, merging streams, and high-velocity fill points. Fluid dynamics keep these pores round, though growing dendrite networks can trap bubbles into dense clusters during freezing.
Where Shrinkage Concentrates
Shrinkage tracks the advancing solidification front. It settles in the last-to-freeze region—the hottest, slowest-cooling core of the casting—while faster-cooling outer walls stay clean. Hot spot centers carry the highest risk: thick walls, isolated bosses, flange roots, rib-to-wall junctions, and metal directly under a riser. Wall transitions introduce another problem. When a thick section meets a thin wall, the thin side solidifies first and chokes off the feed path, driving shrinkage into the junction on the thick side. To prevent junction hot spots, design transition lengths to at least 3 times the wall thickness change (L/t ≥ 3).
Comparison at a Glance
|
Defect |
Typical Zone |
Cross-Section Shape |
Distribution Trait |
|---|---|---|---|
|
Gas porosity |
Near-surface, gating downstream, turbulent zones |
Round or oval, smooth boundary |
Strung along flow lines or dense subsurface clusters |
|
Shrinkage |
Last-to-freeze zones, hot spot centers, thick side of wall junctions |
Irregular, dendritic, connected, or sponge-like |
Follows thermal gradient and feed path, concentrated in thick sections |
|
Mixed porosity |
Inside hot spots, isolated liquid pools, shrinkage-adjacent gas zones |
Round pores stretched, notched, or linked together |
Gas and shrinkage merge near the end of solidification |
When Both Overlap in the Same Pocket
Gas and shrinkage rarely stay isolated. As a pocket shrinks, local negative pressure drops dissolved gas past its solubility limit, triggering bubble formation inside the hot spot. In a typical progression, a round gas pore nucleates first inside an isolated pool of liquid metal. As the surrounding metal contracts during freezing, shrinkage pulls along interdendritic gaps and merges into the gas pore. This distorts the round void into an oval, teardrop, crescent, or branched shape. Link several pores through shrinkage channels, and you get a sponge-like composite defect.
This pattern frequently appears at thick-to-thin wall junctions. A round gas pore forms at the hot spot center, and once the thin wall freezes, the closed feed path forces shrinkage outward into the existing bubble. On a metallographic cross section, this appears as a round cavity bordered by a dendritic dark zone or an unevenly expanded pore rim, identifying it as a composite defect.
As a general field rule, smooth, isolated, near-spherical voids point to gas. Angular, branched voids linked toward the final freezing zone point to shrinkage, or a combined defect requiring metallographic confirmation before you adjust the process.
Step-by-Step Cut-Section Inspection Procedure
A rushed cut tells you nothing. Follow this sequence to pinpoint the defect without guesswork.
1. Document before you cut. Record the casting number, alloy, heat lot, mold orientation, pouring direction, and gate/riser/chill layout. On the drawing, mark thick-to-thin transitions, internal corners, and any areas isolated from feeding paths.
2. Choose the section deliberately. Cut through the predicted thermal center, then take a second section normal to the feeding direction. ASTM E3 calls for orienting the cut longitudinally, transversely, or parallel to the surface while minimizing cut-induced alteration. Log the exact coordinate (such as “3 mm from block mid-width”).
3. Cut with control. Use a band saw or abrasive cut-off wheel flooded with coolant. Cut just outside the target plane, then clean it up with a light finishing pass. Label and photograph the cut face right away.
4. Prepare without hiding pores. Grind through finer SiC grits, rotating the sample 90° between papers. Stop once the surface is flat and clean. Over-polishing to a mirror finish smears metal across voids, making pores look smaller or disappear.
5. Examine macro first. Check the face with the naked eye, then confirm details with a 5–10× hand lens. Note the pore count, size range, shape, and distance from risers and hot spots. Calculate:
-
Pore density = number of pores ÷ examined area
-
Porosity area fraction = (total pore area ÷ examined area) × 100%
6. Confirm under magnification. Use optical microscopy at 25–100× to evaluate morphology, stepping up to 500× for interdendritic microporosity. Smooth cavity walls point to gas; branched, interconnected networks point to shrinkage.
7. Validate against simulation. Align the cut plane to your predicted hot-spot coordinates, then calculate positional error with E = √[(xₒ-xₛ)² + (yₒ-yₛ)² + (zₒ-zₛ)²].
Verification Methods Beyond Visual Inspection
A cut section shows a single plane. When a failure analysis report or customer dispute is on the line, that single view is not enough. Four verification methods bridge the gap between what you see on the surface and what occurred inside the metal.
X-Ray and Industrial CT: Mapping Pore Geometry in 3D
2D X-ray runs at 80–300 kV and gives you a fast initial screen, but overlapping pores can mask true defect shapes. Industrial CT resolves this by capturing true 3D volume, maximum dimension, sphericity, connectivity, and spatial position at 50–500 μm voxel resolution. It costs more and takes longer, but it is the right call for first-article validation and failure analysis. Scan the full casting with X-ray first, then send suspect zones to CT. Isolated gas pores show high sphericity and low connectivity, while shrinkage networks show low sphericity, high connectivity, and visible dendritic boundaries.
Metallographic Confirmation at Higher Magnification
Section directly through the maximum pore cross-section identified by CT. Work from rough grinding to final polish without smearing the pore edges. Classify pore morphology at 25–100×, then increase magnification to check interdendritic liquid channels and oxide films. Record area fraction, roundness, and dendrite coverage along the pore wall. Keep in mind that a single cross-section cannot establish 3D connectivity on its own.
SEM-EDS for Oxide and Inclusion Confirmation
When a void contains residual particles or a suspicious film, SEM-EDS identifies the chemistry. Si and O combined with Al points to silica sand or alumina inclusions. Fe and Mn oxides suggest slag or low pouring temperatures. Heavy concentrations of carbon and oxygen without foreign particles suggest a moisture or organic gas origin, though chemical readings cannot confirm that source by themselves. Treat EDS as corroborating evidence rather than a standalone verdict.
Linking Process Data to Defect Shape
Build a batch-level table that matches melt hydrogen, pouring temperature, core moisture, and permeability against pore sphericity and connectivity. In one green sand run, holding core moisture below 0.3% cut the risk of volatile gas. Confirm the defect type by combining every stream of evidence: foundry process logs, CT geometry, metallographic dendrite structures, and SEM-EDS chemistry.
Decision Rule: Quick Diagnostic Logic for Field Use
Two checks settle most bench arguments. Smooth, round, and isolated voids mean gas porosity. Rough, dendritic cavities sitting on a hot spot mean shrinkage.
Follow the steps in order. First inspect shape and wall texture. If the void is round or near-spherical with a smooth, bright wall, look at its distribution. Isolated or scattered pores confirm gas. If the round pore ties into a dendritic network, stop and flag it as a composite defect instead of forcing a single label.
If the void is rough, angular, or branched, check its location next. A rough, irregular cavity in a thick wall, rib junction, or section transition confirms shrinkage. If that same rough void sits away from any hot spot, send it to metallography or CT rather than guessing.
Treat it as a composite defect whenever you find:
– Smooth, isolated pores mixed with rough, branched voids in the same zone
– A round pore core with dendritic edges
– Smooth wall sections inside a defect located at a hot spot
– Multiple gas pores linked through a shrinkage network
– A 2D cut section that cannot confirm connectivity
Before You Sign the Report
Preserve the evidence first. Photograph the defect location, size, and fracture morphology. Mark the gate, riser, wall thickness, and casting orientation, then log the heat number, alloy grade, and pour temperature.
Reject or isolate any part with defects on a sealing surface, pressure wall, or fatigue-critical zone until metallography or CT confirms a single defect type. For your final release call, matching shape and location justifies signing off in the field. Any conflict, connected void, or critical zone requires lab confirmation.
Corrective Actions: From Diagnosis to Process Improvement
Diagnosis without action produces a well-documented scrap pile. Once you confirm gas porosity versus shrinkage, fix the actual variable instead of cranking up pour temperature, which makes both defects worse.
For gas porosity, degas every heat with argon or nitrogen. Control rotor speed, treatment time, and melt temperature rather than relying on operator habit. For hydrogen-sensitive alloys like aluminum, tie degassing to measurable release criteria (reduced-pressure test, density index, or inline hydrogen reading), and build a rotor-speed-to-density-index correlation for each alloy grade. Dry cores at 150–250°C depending on the binder system, confirming release through residual moisture checks and constant weight. Place vent slots or breather plugs at pore clusters, keeping vent cross-sections large enough to let gas escape without causing sand erosion.
For shrinkage, risers must solidify after the adjacent casting zone, placed at the largest modulus or isolated hot spot. exothermic sleeves extend feeding distance 20–40%. External chills with a 20–50 mm² contact area can cut macro shrinkage 30–50% when matched to hot spot modulus; oversized chills cause cold shuts instead.
Validate changes across 3–5 consecutive heats. Track porosity area fraction, defect size, density index, and scrap rate before locking parameters into pre-pour checklists and core release standards.
Conclusion
Rounded, smooth-walled pockets scattered across a casting point to trapped gas, while jagged, dendritic voids near thick sections or risers signal a shrinkage defect. Shape, location, and surface texture reveal most of the problem, but confirming the call with an X-ray or metallurgical cross-section removes guesswork before you commit to a fix.
Accurate diagnosis keeps scrap rates from climbing. If you mistake shrinkage for gas porosity, you end up tightening melt controls while poor feeding design continues to ruin parts. Identifying the defect correctly directs you to the actual solution immediately.
Next time you evaluate a cut section under the light, run it through the decision checklist in this guide before writing up the report. Better yet, build it into your QC training so every inspector on the floor makes the same call every shift.