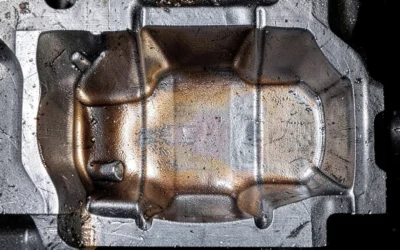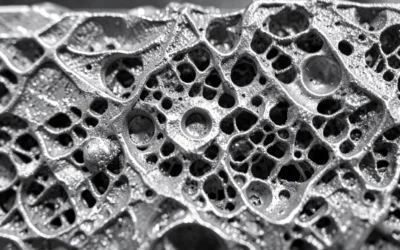
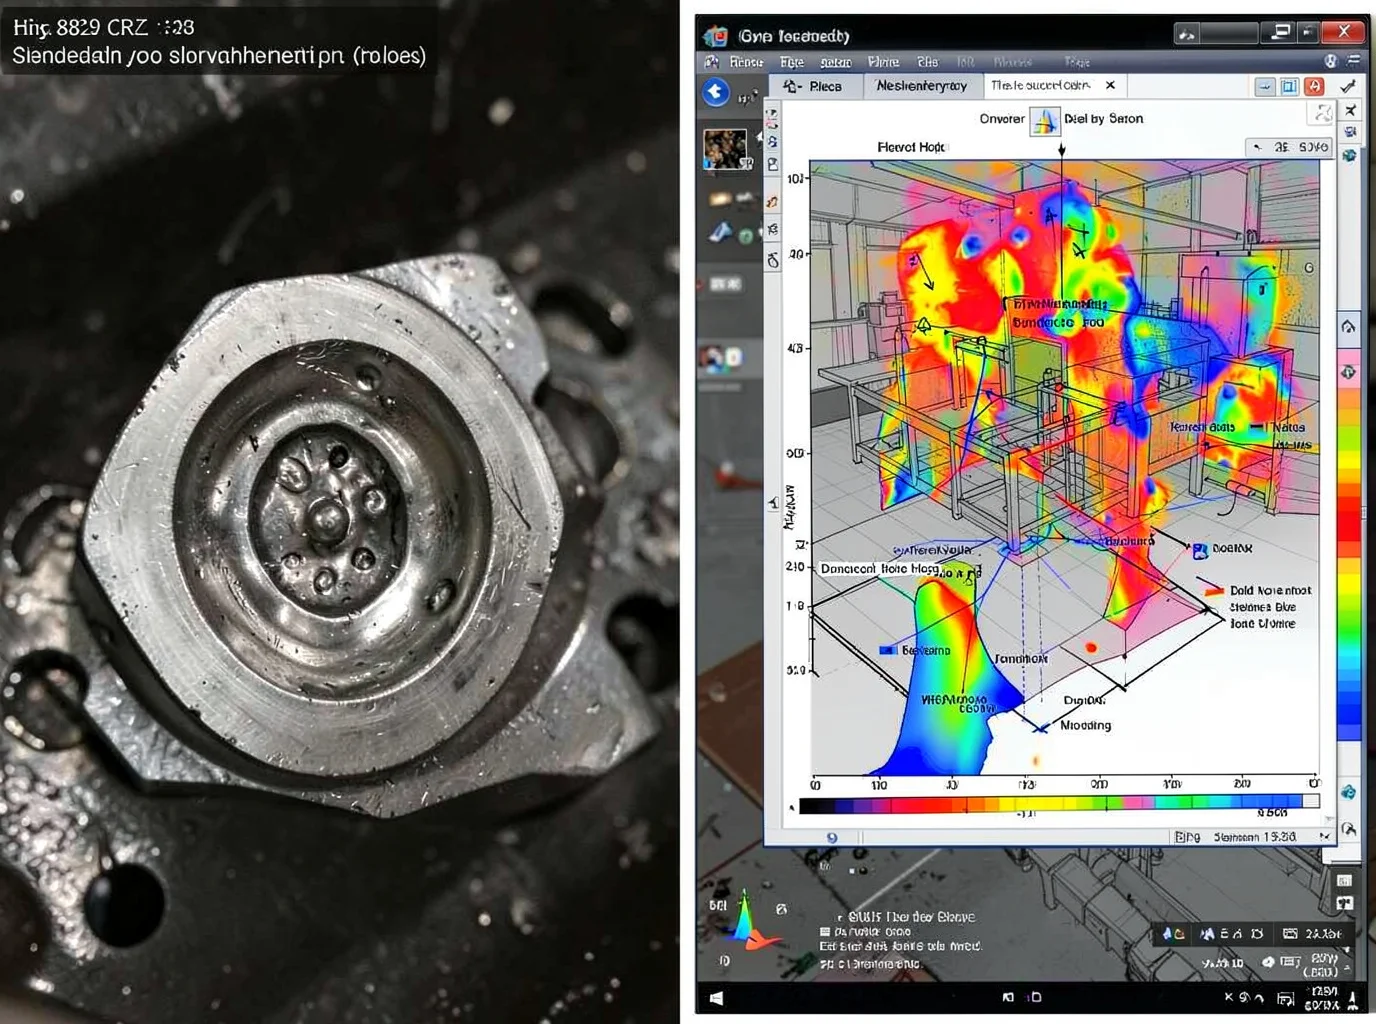
A casting comes out of the mold looking perfect. Then QC cuts it open, or worse, it fails in service, and there’s a cavity sitting right where the wall was thickest. metal casting shrinkage is pure physics. Every alloy contracts through three distinct stages as it cools, and when feed metal can’t keep pace with that contraction, you get voids. Your gating system design and riser placement have to account for it before the pour starts. This guide breaks down the metallurgical mechanics behind solidification shrinkage, shows how to tell a shrinkage cavity apart from porosity, and walks through the design and process fixes, from directional solidification to simulation software, that foundries use to catch this defect before it ever reaches the customer.
What Is Metal Casting Shrinkage: The Three-Stage Formation Mechanism
Molten metal never cools evenly. It moves through three distinct phases on its way to becoming a solid part, contracting differently in each. Knowing where you are in that sequence is the whole game.
|
Stage |
What’s Happening |
Typical Volume Change |
Defect Risk |
|---|---|---|---|
|
Liquid shrinkage |
Metal cools from pour temperature down to the liquidus |
~0.5–2% |
Low direct risk, but early channel closure here sets up trouble later |
|
Solidification shrinkage |
Liquid transforms to solid through the mushy zone |
Aluminum ~6.6–7%, low-carbon steel ~2.5–3%, white iron ~4–5.5%, gray iron can range −2.5% to +1.6% |
Primary source of shrinkage cavities and porosity |
|
Solid-state shrinkage |
Cooling from solidus to room temperature |
Aluminum ~1.3–1.6%, steel ~2.0–2.6%, gray iron ~0.6–1.2% |
Dimensional shrink, warping, residual stress |
The real damage happens during solidification shrinkage. As atoms pack tighter into solid form, density goes up and volume drops. Solidification starts at mold walls, chills, and thin sections, then marches toward thermal hot spots and risers. As dendrites grow and interlock, liquid feed metal struggles to flow through the narrowing channels between them. Once that dendrite network seals off a hot spot before liquid finishes feeding it, you get negative pressure, interdendritic gaps, and either scattered microporosity or a concentrated cavity. The casting temperature window matters too. Aluminum alloys solidify between 600–660°C, cast steel around 1,400–1,530°C, and iron around 1,150–1,400°C. Alloy chemistry and pour temperature both shift where and how fast that window closes.
Why Shrinkage Forms Where It Does: Hot Spots, Thick Sections & Isolated Nodes
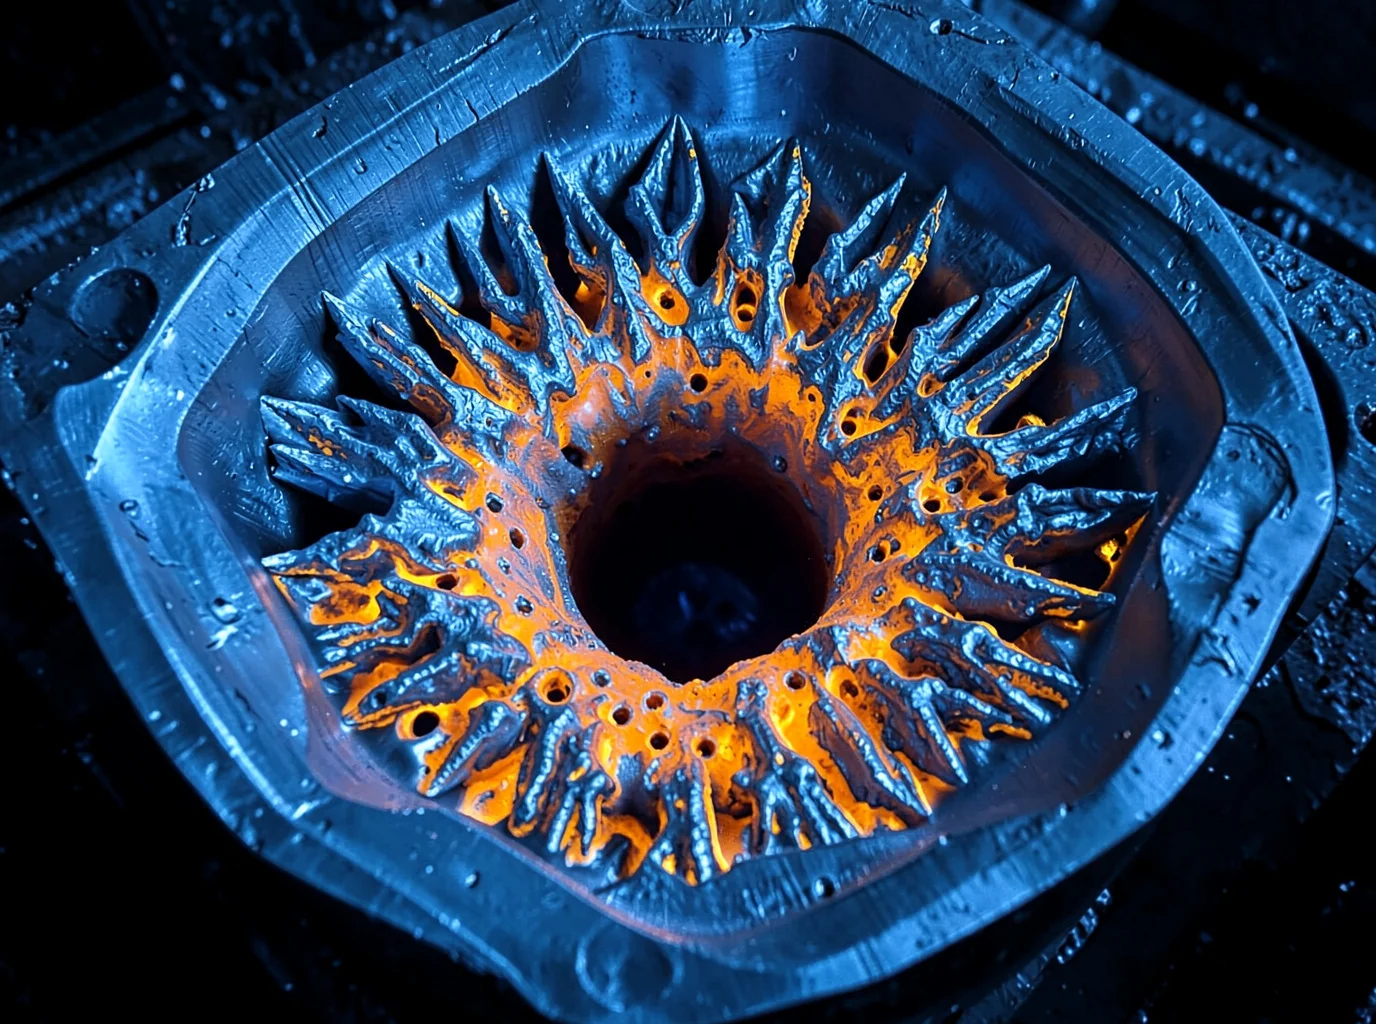
Shrinkage happens in predictable areas. Once you understand the cooling physics, you can catch defects before pouring starts.
The math behind thick-wall failure
Chvorinov’s rule shows that solidification time scales with (V/A)², where V represents volume and A is cooling surface area. Thick walls, heavy bosses, and large fillet intersections carry a higher modulus (M = V/A), which slows their cooling rate. An outer shell freezes first while the molten core continues to contract without an open feed path. That trapped contraction leaves a centerline shrinkage cavity or interdendritic porosity.
Where hot spots typically form
-
Junctions between thick and thin walls
-
Intersections where two or more ribs, flanges, or hubs cross
-
Isolated bosses, lifting lugs, shaft bosses, and heavy pads
-
Spots where a large fillet overlaps a thick section
-
Closed-off cavities surrounded by sand cores or thin walls
-
Mass concentrations located far from risers, chills, or working feed paths
Cross-nodes are the worst offenders
At a rib-to-wall intersection, material volume piles up without adding matching cooling surface area. Adding a generous fillet radius at that intersection drives the local modulus higher still. Heavy intersections and oversized fillets remain the primary zones for shrinkage cavities.
Why isolated nodes develop porosity instead of cavities
An isolated boss or thick lug often sits within a thinner surrounding wall. That thin wall solidifies first, forming a solid shell before the thick node finishes shrinking. By the time the node needs feed metal, the supply channel has closed off. The volume drop shows up inside the node as scattered micro-porosity or draws inward as a surface sink mark.
A classic bad-design case
Placing a 12 mm boss directly onto a 3 mm wall creates a severe hot spot right at the boss root. As the boss contracts, it attempts to pull feed metal through the surrounding 3 mm wall, which has already frozen solid. This starvation leaves root-level shrinkage cavities, porosity, or distortion. To resolve this, hollow out the boss, replace the step with a tapered pad, or carry the load through ribs rather than solid mass.
Transition geometry that actually works
-
Taper wall thickness transitions gradually rather than stepping them at right angles.
-
Follow the transition rule of length ≥ 3Δt. A 9 mm thickness difference requires at least ~27 mm of transition run.
-
Apply a 1:4 taper ratio as a baseline DFM guideline.
-
Core out thick bosses, retain only the structural wall thickness required, and use supporting ribs instead of solid mass.
How feeding paths get cut off
Feeding failure depends on path continuity as much as riser volume. Standard feed-path failures include:
-
The riser sits on a thin section while the hot spot remains trapped in a thicker node.
-
The riser neck is too narrow or long, freezing before the hot spot can feed.
-
A thin wall, narrow rib, or sudden drop in thickness separates the hot spot from the riser.
-
Multiple hot spots share a single riser, and an intermediate node freezes early, cutting off downstream feed paths.
-
The riser sits near the defect zone but carries too small a modulus, losing liquid pressure before the target section finishes solidifying.
The failure mechanism itself
Once the outer shell solidifies, feed metal must move along a continuous liquid path from the riser to the last-freezing zone. If any intermediate section freezes into a solid bridge, that liquid channel pinches shut. Everything downstream of that bridge is isolated, regardless of how much molten metal remains in the riser. As that trapped volume contracts, it leaves behind an internal void.
Riser placement rules that follow from this
-
Position risers directly on the largest hot spot, thick-wall junction, or isolated boss rather than centering them geometrically on the part.
-
Target a riser modulus 1.2–1.5 times the modulus of the hot spot to keep the riser liquid until the casting solidifies.
-
Use top risers for vertical hot spots and side risers for lateral sections.
-
Apply insulating sleeves, exothermic sleeves, or chills to enforce directional solidification from thin sections toward the feeder.
Closed hot spots: the hardest case
In closed box sections, valve bodies, and pump housings, thick internal flanges and core-bound corners often lack a direct feeding route. Outer walls and connecting ribs freeze first, leaving the internal hot spot isolated as it contracts. Mounting a riser on a distant flange will not solve this, because the connecting wall freezes early and blocks feed metal from reaching the core.
A practical checklist for avoiding this
-
Maintain uniform wall thickness across the casting.
-
Replace solid nodes with thin walls supported by reinforcing ribs.
-
Core out thick bosses, hubs, and lifting lugs.
-
Trim solid volume and eliminate oversized fillets at intersections.
-
Supply isolated hot spots with dedicated risers, feed paths, or local chills.
-
Run casting simulations to verify freezing order, liquid connectivity, and riser neck cutoff times.
-
Orient the highest-modulus sections where feed paths can reach them directly.
Shrinkage Cavity vs Shrinkage Porosity: Identifying the Defect Type
Voids in a casting may look similar on the surface, but a shrinkage cavity and shrinkage porosity stem from different root causes and require different process adjustments. Quality teams need to classify the defect accurately before changing gating, risering, or melt practices.
|
Defect |
Key Features |
Root Cause |
Where You Find It |
|---|---|---|---|
|
Shrinkage Cavity |
One large, irregular, dendritic void with rough internal walls |
Insufficient feed metal; riser froze early or was sized or placed incorrectly |
Thick sections, hot spots, directly under the riser; radiography shows a dark indication with ragged edges |
|
Shrinkage Porosity |
Sponge-like cluster of small, interconnected voids between dendrites |
Blocked feed channels in the mushy zone, wide freezing range, or poor thermal gradient |
Center of thick walls and last-to-freeze zones; CT reveals an interconnected network |
|
Surface Sink |
Localized surface depression without cracking |
Solidified skin collapses inward as the molten core continues to contract |
Top of thick walls, fillets, and hot spots |
|
Centerline Shrinkage |
Linear or worm-like porosity running along a plate or rib centerline |
Solidification fronts meet from opposite mold walls and trap remaining liquid |
Geometric center of flat or elongated sections |
|
Open Shrinkage |
Funnel- or tube-shaped cavity open to the casting surface |
Shrinkage void extends all the way to the exterior |
Top of heavy sections near risers |
Shrinkage Porosity vs Gas Porosity: The Shape Test
Alloy solidification and dissolved gas both leave voids, but the two defects look distinct under inspection:
Shape: Shrinkage porosity is irregular, angular, and branching. Gas porosity forms round, near-spherical, or oval cavities.
Pore walls: Shrinkage voids show rough, dendritic walls formed as the final liquid froze between dendrite arms. Gas pores have smooth walls because internal gas pressure forces the bubble into a sphere.
Distribution: Shrinkage concentrates at hot spots and along the thermal centerline. Gas voids can disperse across the section or line up along oxide films and trapped air pockets.
Fracture surface: Shrinkage exposes a rough, intergranular fracture with a visible dendrite skeleton. Gas pores leave smooth, rounded depressions that can show oxide discoloration.
Round, smooth, isolated voids point to gas. Rough, branching, interconnected networks point to shrinkage. Standard 2D radiography cannot always resolve overlapping indications, so confirm borderline cases with cross-sectioning, metallography, or CT.
How Foundries Confirm It
Industrial CT: Maps internal cavities, microporosity, and centerline shrinkage in 3D, measuring total pore volume, sphericity, and network connectivity. This is the most reliable nondestructive tool for distinguishing spherical gas pores from branching shrinkage networks.
Metallography: Requires sectioning through the defect area, followed by polishing and etching. Optical or SEM examination reveals whether the voids sit along dendrite boundaries.
Fractography: Evaluates broken components. Shrinkage displays a rough intergranular fracture surface, whereas gas porosity leaves smooth, rounded pockets that can be checked with SEM/EDS for traces of oxides or inclusions.
Radiography (RT): Offers fast screening on the production floor for heavier castings, but 2D projections can superimpose separate indications or miss thin porosity aligned parallel to the beam. Confirm questionable indications with CT or destructive sectioning.
Visual and liquid penetrant inspection (PT): Reveals open shrinkage cavities and surface sinks directly on the casting exterior, though neither test detects closed internal porosity.
Root Cause Diagnosis: A Systematic Checklist for Foundry Engineers
Guessing wastes metal and shop time. A structured diagnostic sequence gets you from “there’s a void” to “here’s the fix” in one pass instead of three redesign cycles.
Four Dimensions to Check, in Order
|
Dimension |
What to Verify |
Decision Rule |
|---|---|---|
|
Location |
Thick walls, bosses, T-junctions vs. thin walls, remote ends, cope surface |
Irregular, dendritic cavities at hot spots point to shrinkage. Rounded pores near the top surface point to gas. |
|
Pouring/filling process |
Metal temperature at furnace, ladle, and mold entry; actual fill time vs. process window; stream stability |
Excess superheat raises gas pickup and widens the mushy zone. Low superheat causes cold shuts. |
|
Feeding/riser system |
Riser-to-hot-spot connectivity, modulus ratio, neck size |
Target riser modulus Mr ≥ 1.1–1.2Mc (carbon steel benchmark). Below that threshold, the riser runs out of liquid metal first. |
|
Casting design |
Section-thickness ratios, isolated heavy zones, fillet proportions |
Transitions beyond 2:1 carry high risk and warrant simulation before you alter tooling. |
The Diagnostic Flow
Start with defect geometry rather than the riser. Confirm it sits in the predicted last-solidifying zone, then check whether a continuous feed path reached a riser or froze early at the neck. Adjust pouring temperature or fill time only after the part geometry and riser connections check out.
Lock the Fix Before Moving On
Section or CT-scan the defect, calculate Mr vs. Mc, and verify riser connectivity before adjusting geometry or directional solidification. Verify the result with repeat radiography before updating the process sheet.
Eliminating Shrinkage Through Casting Design Optimization
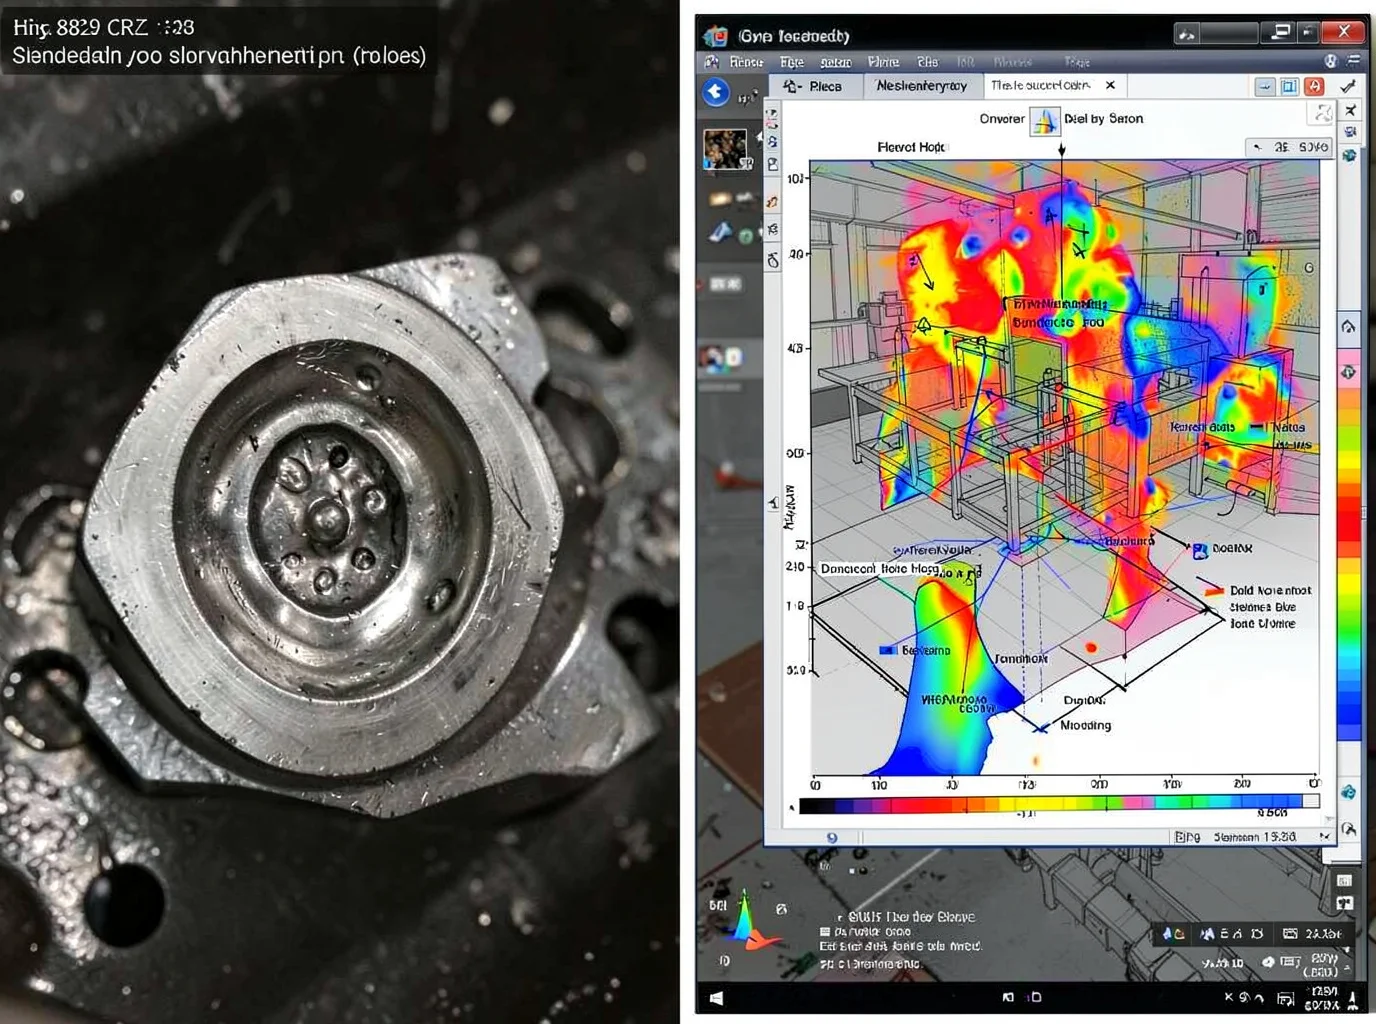
Design changes cost nothing on the drawing board, but they cost everything once you cut tooling. Get the fillet radii and rib proportions right before machining the pattern, and you clear out most hot spots without touching gating or alloy chemistry.
Fillet Radius: Size It to the Section, Not to Habit
-
Baseline rule: Internal fillet radius R ≥ t, where t is the adjacent wall thickness.
-
At thickness transitions: Increase that to R ≥ 1.5 × t(thin wall) to shrink the thermal node and lower stress concentration.
-
Three-way junctions (where a boss, wall, and rib meet): Size the fillet to at least 1.5× the thickest adjacent section.
-
Stainless investment casting: Internal fillets usually run between 1.5 and 5.0 mm, reserving larger radii for thick walls and deep cavities.
-
Oversized fillets backfire. Beyond a certain radius, the extra metal volume creates a fresh hot spot. Aim for a smooth, continuous transition between sections rather than maximum roundness.
Rib Thickness and Layout
-
Keep rib thickness between 50% and 70% of the adjacent wall thickness, never higher.
-
Never replace ribs with solid bosses. Thick masses cool slowly and feed poorly, while thin ribs deliver equal stiffness with far less shrinkage risk.
-
Blend rib-to-wall junctions with generous fillets, and keep multiple thick ribs from converging at a single point. Stagger, split, or taper them instead.
-
Route ribs directly along the load path (bending, compression) instead of wrapping a boss in a continuous thick collar.
-
Taper rib ends to a thin edge or an angled cutoff to eliminate terminal hot spots.
-
For heavily loaded bosses, use a hollow boss stiffened with a thin annular rib instead of a solid pad.
Case Study: Redesigning Gates and Risers Around the Hot Spots
One production casting repeatedly failed at its riser necks and fillet junctions because both areas formed starved thermal nodes. The foundry solved this by relocating the gate, increasing ingate thickness from 10 mm to 25 mm, and replacing two crescent-shaped insulating risers with three smaller round ones placed over the actual hot spots rather than the geometric center.
|
Metric |
Before |
After |
Improvement |
|---|---|---|---|
|
Shrinkage porosity/cavity rate |
20% |
2% |
−90% |
|
Gas porosity rate |
15% |
1% |
−93.3% |
|
Total scrap rate |
10% |
4% |
−60% |
Gate dimensions and riser counts only work when wall transitions, fillet junctions, and isolated thick sections match the feed path. Adding extra machining stock almost never cures internal porosity.
Pre-Simulation Design Checklist
-
Maintain a max-to-min wall thickness ratio of 2:1 or less.
-
Ensure every thickness transition satisfies L ≥ 3Δt.
-
Use a 1:3 to 1:5 taper for thick-to-thin junctions instead of a step.
-
Size standard internal fillets to R ≥ t, increasing to R ≥ 1.5t at critical junctions.
-
Set rib thickness to 50–70% of the parent wall thickness.
-
Core out all bosses so no isolated thick rings remain.
-
Limit converging heavy ribs to no more than one per node.
-
Align fillets, rib roots, and boss bases with the intended feed path.
-
Run solidification simulations after every geometry change to confirm hot spot locations, liquid-phase duration, and feeding directions before cutting tooling.
Gating & Riser System Design: The Core Solution for Directional Solidification
Numbers decide whether a riser works. The modulus formula M = V/A (volume over cooling surface area) tells you how long a section stays liquid, and every reliable calculation starts with it.
The Riser Sizing Formula
First, calculate the hot spot modulus: Mh = Vh/Ah. Next, set the riser modulus at Mr = (1.2–1.5)Mh. Treat 1.2 as your absolute engineering floor, and push to 1.5 for side risers, fast-cooling zones, or long feeding distances.
To prevent the riser neck from freezing early, maintain this ratio across the casting, neck, and riser:
M(casting) : M(neck) : M(riser) = 1 : 1.1 : 1.2
Worked example: A steel hot spot measures Vh = 180,000 mm³ and Ah = 60,000 mm², giving Mh = 3.0 mm. Applying a 1.3 factor sets Mr to 3.9 mm. For a cylindrical riser where Mr ≈ D/6, the diameter D reaches roughly 23.4 mm. Round up to a standard 25 mm riser, then confirm feeding distance and neck freeze timing in simulation or trial pours.
Choosing the Right Riser Type
|
Type |
Best For |
Key Advantage |
|---|---|---|
|
Top riser |
Flat plates, flanges, hot spots directly below |
Shortest gravity feed path, simplest neck |
|
Side riser |
Walls, columns, areas with no top access |
Flexible placement, needs higher Mr/Mh ratio |
|
Insulating sleeve |
Large steel/ductile iron castings |
Cuts radiant heat loss, extends liquid life |
|
Exothermic sleeve |
High-shrinkage alloys, isolated hot spots |
Generates heat to delay freezing, shrinks riser size |
Open Top risers shed heat quickly and typically need insulating or exothermic covers. Metal yield in well-designed sleeve systems runs 30–35%, compared to 20–45% across the wider industry. Determine the riser placement first, then reduce its volume with a sleeve rather than pouring excess metal.
Chills: Pulling Heat Instead of Adding Metal
Place external chills at the base of a hot spot, across thick-to-thin junctions, or between two risers to prevent an unfed node from forming. Round all chill edges to avoid sharp thermal gradients. Match steel chills with steel castings, and keep internal chills clean, dry, and alloy-compatible to prevent gas and inclusion defects. When placed correctly, chills extend effective feeding distance by roughly 50%.
In one documented case, combining riser reduction, chill placement, and simulation cut casting weight by 69 kg per part, saved about 82 tons of metal annually, and raised casting yield by 53%.
Pouring Process Control: Temperature, Speed & Turbulence Management
Temperature doesn’t lie, but it does punish. Pour too cold and the metal freezes before it fills the mold. Pour too hot and you trade one defect for another, often gas porosity hiding inside what looks like a shrinkage problem.
Pouring Temperature by Alloy
|
Alloy / Process |
Typical Range |
Risk if Too Low |
Risk if Too High |
|---|---|---|---|
|
Zinc (Zamak) |
420–440°C |
Cold shuts, incomplete fill |
Oxidation, die erosion |
|
AZ91 Magnesium |
680–720°C |
Premature freezing, misruns |
Burning, gas pickup |
|
A356 Aluminum |
690–730°C |
Cold shuts, poor feeding |
Hydrogen solubility, shrinkage-porosity interaction |
|
Aluminum Bronze |
1,150–1,200°C |
Misruns, cold laps |
Mold attack, shrinkage tendency |
|
Carbon Steel (investment) |
1,520–1,580°C |
Misruns, inadequate feeding |
Mold reaction, gas defects |
|
304/316 Stainless |
1,550–1,620°C |
Incomplete fill |
Oxide/inclusion formation |
Control the superheat above liquidus rather than chasing absolute temperature. Target 35–55°C for zinc, 75–115°C for A356, 85–125°C for AZ91, and 100–180°C for bronze. Use the lowest superheat that still fills and feeds the mold.
Fill Speed and Turbulence
-
Aluminum stream speeds around 2.0–2.8 cm/s produce the cleanest surface finish. Faster streams break the free surface, fold oxide films, and trap air.
-
Keep the pouring cup full and the stream submerged. Interrupting the pour causes the level to surge and suck in air.
-
Avoid high free-fall jets. Bottom-pour or tundish systems reduce plunging and folding.
-
Lower the ingate velocity to prevent air entrainment. Throttling at the nozzle tends to increase local turbulence instead of calming it down.
-
Keep critical runner sections below Re 20,000 where geometry allows.
Mold preheat and sand thermal conductivity shift the entire equation. Insulating sand extends fluidity, but it increases shrinkage porosity without adequate risering. Degassing cuts hydrogen-driven gas porosity, yet it never substitutes for proper feeding. When both defects overlap, pores grow larger and more irregular.
Using Solidification Simulation Software to Predict & Prevent Shrinkage
Trial-and-error tooling changes cost real money. Whether dealing with a pattern revision, a new riser core, or a scrapped batch, simulation software catches tooling errors before metal touches sand. Foundries lean on three platforms most: MAGMASOFT®, ProCAST, and FLOW-3D CAST, and each earns its keep differently.
What each platform does best
MAGMASOFT®: Models mold filling, solidification, shrinkage cavities, porosity, hot spots, feeding paths, and riser or gating layouts. Its design-of-experiments (DoE) module runs automated comparisons across riser type, count, placement, and chill geometry. In one steel casting project, the software evaluated 12 combinations (3 riser shapes × 2 sleeve types × 2 chill layouts), and a cylindrical riser paired with an effective bottom chill gave the best result.
ProCAST: Couples filling, heat transfer, solidification, and stress or distortion analysis in one pass. It tracks liquid-to-solid fraction, solidification sequence, temperature fields, hot spots, and shrinkage risk across aluminum, steel, iron, and high- or low-pressure die casting.
FLOW-3D CAST: Focuses on free-surface filling, air entrainment, oxide film tracking, and gating design. It compares gate cross-sections, ingate positions, fill times, and surface velocity against feeding connectivity as solidification ends.
The metrics that matter
Look past the hot-spot heat map and pull these specific metrics:
-
Hot spot location and liquid-phase duration
-
Solidification sequence and isolated liquid pockets
-
Feed path continuity from riser to thick sections
-
Niyama criterion, liquid fraction, thermal gradient, and cooling rate
-
Shrinkage cavity and porosity volume, location, and severity
-
Riser efficiency, casting yield, and filling defect risk
Running Multi-Variant Comparisons Instead of One Simulation
Single-shot simulations tell an incomplete story. Parametric, DoE runs show which design delivers the best production outcome.
Riser comparisons should cover count, diameter-to-height ratio, shape (cylindrical, oval, conical), neck dimensions, and sleeve type. Evaluate these against three combined metrics: porosity volume, final casting yield, and riser weight. Choosing a riser based solely on a hot-spot map ignores the impact on yield.
Gating comparisons need to verify sprue, runner, and ingate cross-sections, ingate placement, and fill sequence. Check whether a thick section freezes off early, whether isolated liquid pockets form, and whether the ingate can feed the part through the end of solidification.
Chill placement requires testing across heavy isolated zones, hot spots, and sections far from any riser sleeve, altering chill size, count, material, and contact area. Extra chilling does not always improve quality. In one MAGMASOFT case, a misplaced chill triggered rapid local freezing and formed white iron nearby. In another steel casting study, 32 chills yielded the lowest porosity, whereas adding more cooling beyond that threshold degraded solidification conditions and caused porosity to rise again.
Calibrating Simulation Against Real Production Data
A model is only as good as its inputs. Before relying on predicted shrinkage values, build a per-defect field record: casting ID, alloy grade, pour temperature, mold/sand temperature, pour time, riser insulation condition, defect location, defect volume, and inspection method.
Overlay simulation results point by point against physical inspection data:
-
X-ray and CT scans: confirms shrinkage location and volume
-
Ultrasonic testing: confirms internal defect zones
-
Sectioning: verifies hot spot shape, porosity structure, and where feeding broke down
-
Thermocouple logs: corrects interface heat transfer coefficients, mold temperatures, and recorded solidification times
Calibrate baseline physics first: material thermophysical properties, liquidus and solidus points, shrinkage rates, interface heat transfer coefficients, sleeve insulation values, and measured pour temperatures. Artificially inflating shrinkage parameters to match a scrap batch produces curve-fitted data rather than a predictive model. Run historical scrap data back through the software, then validate the settings against a later production run. Keep at least one production batch out of the calibration pool as an independent check.
FoundryMax pairs simulated porosity predictions with field X-ray or ultrasonic testing, treats high-risk zones as primary inspection targets, and completes 3 to 4 design iterations before committing to tooling.
What This Looks Like in Production
-
Gray iron case: The initial simulation showed that the riser and neck could not offset solidification shrinkage, matching the cavity locations found in production. Adding a chill by itself caused premature local freezing and formed white iron. Redesigning the geometry and feeding path eliminated the porosity in subsequent runs.
-
875 kg GS20Mn5 steel casting: Screening 12 combinations of riser shapes, sleeve types, and chill configurations against porosity and yield targets identified a cylindrical riser and lower chill as the best option.
-
Flywheel casting: Simulation flagged shrinkage risks near the riser neck and bore area. After adjusting neck geometry and adding risers and chills, the shop ran the revised layout defect-free.
-
Die casting defect trace-back: MAGMASOFT’s original simulation correlated closely with production shrinkage cavities. Subsequent DoE trials evaluated riser size, machining allowances, and copper chill inserts, confirming riser size as the dominant factor in reducing porosity.
-
DANA Spicer ductile iron carrier: Engineers used MAGMASOFT to analyze fill patterns and build a custom gating layout to improve metal flow on a heavy-truck ductile iron carrier.
Field acceptance benchmarks worth tracking after a redesign include the overlap rate between predicted porosity zones and CT or X-ray findings, scrap rate reduction, porosity volume, riser weight, overall casting yield, and stability across consecutive production runs.
Process Control Benchmarks: What “Zero Shrinkage” Foundries Do Differently
Published case studies do not share a single corporate KPI, but their before-and-after data gives buyers an auditable benchmark to evaluate suppliers against.
|
Management Item |
Benchmark Target |
Verification Method |
|---|---|---|
|
Shrinkage in critical functional zones |
Zero in drawing-restricted zones; 100% batch RT/CT pass rate |
RT, CT, sectioning |
|
Hot spot count |
One primary hot spot per critical casting; complex parts require a numbered hot-spot map |
Simulation report + thermal imaging/sectioning |
|
Feed path |
At least one continuous liquid path from each primary hot spot to a riser; zero premature freeze-off breaks |
Liquid fraction / solidification sequence simulation |
|
Riser neck effective time |
Neck freezes after the hot spot it feeds finishes solidifying |
Simulation time curve + field validation |
|
Process window |
Pour temperature, pour time, and holding time all carry SPC upper/lower limits |
Furnace-floor records, temperature tracking |
|
First-article sign-off |
Simulation, first-article inspection, and batch release review after every process change |
APQP/PPAP documentation |
|
Internal scrap |
Shrinkage cavities and porosity tracked under a standalone defect code; mature suppliers target below 1%, near-zero for critical parts |
Monthly quality reports |
|
Yield |
Riser geometry optimized alongside defect elimination |
Case data below |
Verified Results Worth Benchmarking
-
One steel casting eliminated all original shrinkage cavities in production after the foundry adjusted padding, risers, and cooling conditions.
-
For an 875 kg GS20Mn5 steel casting, engineers tested 12 combinations of riser shapes, sleeve types, and chill configurations to reduce porosity and protect yield, avoiding an oversized riser.
-
A wheel-hub project corrected the riser neck-to-basin geometry, eliminated porosity, improved yield by 10%, and removed two insulating sleeves.
-
A small-batch steel casting project paired four risers with four chills to isolate each hot spot. Enlarging the central riser alone was neither economical nor effective at fixing the broken feed path.
How Buyers Should Read Supplier Capability
Capable suppliers run part geometry, cooling layouts, riser feeding, and shop-floor parameters through a single loop of simulation, trials, and inspection. They report shrinkage rates, hot spot counts, yield, and process capability as an integrated package. Weaker operations rely on oversized risers, excess machining stock, or repeated trial pours. Contract the foundry that proves defects were driven into the riser, critical zones stayed clear, and batch parameters remained within control limits throughout production.
Conclusion
Metal casting shrinkage is physics you can predict and control. Solidification shrinkage follows the metal’s cooling sequence, so you can engineer directional solidification through smart riser design in casting, keep feeding distances within proven limits, and eliminate guesswork around hot spots.
Foundries that eliminate shrinkage for good pair rigorous Gating System design with casting simulation software to catch defects on screen, months before a part ever hits the shop floor.
If you are troubleshooting a persistent shrinkage cavity or porosity issue right now, avoid guessing with pour temperatures. Run the diagnostic checklist from this guide first, then validate your fix in simulation before committing to tooling changes.