A single misjudged specification—too coarse a PPI rating, a density mismatch, or an overlooked material grade—can turn a clean pour into a scrapped batch riddled with inclusions. For foundry engineers and procurement teams evaluating SiC Ceramic foam Filters for Metal casting, the real challenge is figuring out which combination of density, pores per inch, and Silicon carbide purity fits your alloy, your Gating System, and your defect tolerance.
This guide cuts through vague datasheet language to show how these three variables interact, and why the right filter for aluminum casting looks nothing like the right filter for iron or copper alloys. You get practical selection logic, comparison data against alternative filter materials, and a verification checklist built to catch sourcing mistakes that inflate rejection rates. If your next PO depends on getting this right, start here.
SiC Ceramic Foam Filters Core Definition and Working Principle
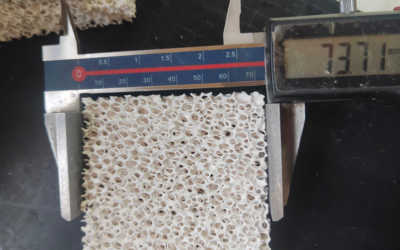
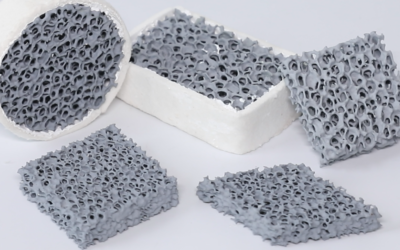
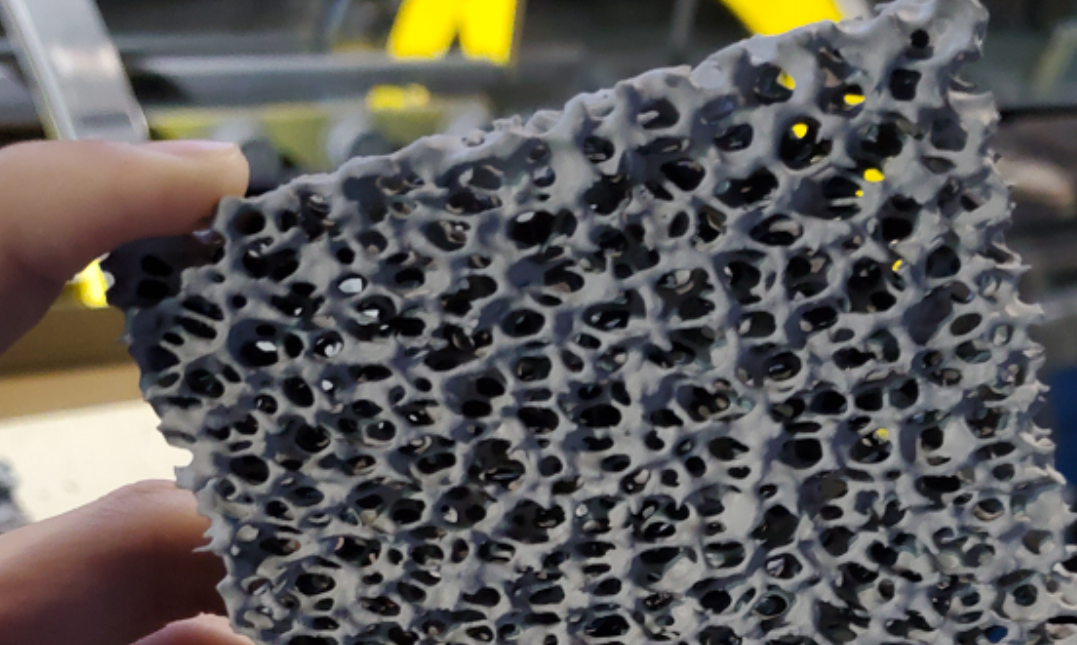
A SIC ceramic foam filter is a silicon carbide refractory block with a three-dimensional, interconnected open-pore structure. Placed in the sprue, runner, or ingate, it catches slag, oxide films, sand particles, and non-metallic inclusions out of molten iron, steel, or copper during the pour.

The filter uses a web of ceramic struts that form tortuous, interconnected channels with 80%–90% porosity. Molten metal winds through these paths, forcing suspended impurities against the ceramic walls instead of letting them pass clean through.
Silicon carbide consists of silicon and carbon in a 1:1 atomic ratio held by strong covalent bonds. It occurs in two crystal structures: hexagonal α-SiC (4H, 6H) and cubic β-SiC (3C). These Si–C bonds give the material high hardness, rigidity, low creep, and thermal shock resistance, which keep the filter intact under metal impact and static head pressure. High thermal conductivity limits internal temperature gradients, while a surface layer of SiO₂ forms at elevated temperatures to slow oxidation, though extended exposure degrades the material over time.
Published ratings place the maximum working temperature around 1500°C, though foundries run them up to 1500–1560°C depending on SiC content, bonding phase, porosity, filter size, and dwell time. SiC serves as the standard choice for gray iron, Ductile Iron, cast steel, and copper alloys because these melts produce severe thermal shock that breaks weaker ceramic materials.
How Molten Metal Filtration Actually Happens
Filtration relies on two simultaneous mechanisms:
-
Surface/cake filtration: Large inclusions, including slag, oxide skins, and sand, collect at the filter entry face once they exceed 50–100 μm. This trapped material builds a cake layer that catches progressively smaller particles, though it also increases resistance to flow.
-
Deep-bed filtration: Smaller particles enter the foam matrix and navigate turns, splits, and narrow passages. They attach to the SiC struts through inertial impaction, interception, surface adhesion, and agglomeration. This traps inclusions down to 10–20 μm, with manufacturer data showing capture down to 1–10 μm for oxide particles.
The filter also serves as a flow straightener. Redirecting the melt through the open pores dampens turbulence, which prevents air entrainment and keeps captured inclusions from washing into the mold cavity.
Volume Density Parameters Explained (0.30–0.50 g/cm³)
When a supplier quotes “SiC density 3.2 g/cm³” on a spec sheet, procurement teams often assume that refers to the finished filter. That 3.2 g/cm³ figure is the true density of solid SiC crystal with zero pores. The ceramic foam filter installed in your gating system runs 0.30–0.50 g/cm³ volume density, because the finished part is 80–90% empty space by design.
True Density vs. Volume Density vs. Porosity
|
Parameter |
What It Measures |
Typical Value |
Why It Matters for Purchasing |
|---|---|---|---|
|
True/skeletal density |
Solid SiC only, no pores |
3.0–3.2 g/cm³ |
Baseline for calculating porosity |
|
Volume density |
Total mass ÷ external geometric volume |
0.30–0.50 g/cm³ |
Indicates lightweighting and overall pore structure |
|
Relative density |
Volume density ÷ true density |
~9–17% |
Compares skeletal content across batches |
|
Total porosity |
1 − (volume density / true density) |
~83–91% |
Should always be reported alongside volume density |
A foam filter manufacturer who lists “density” without specifying the type gives you half an answer. Request both numbers along with the calculated porosity, and check how the true density was measured. Helium pycnometry and liquid displacement give different results, while surface roughness, chamfers, and coatings skew volume density readings.
How Density Affects Filtration Performance
|
Volume Density Range |
Est. Porosity (vs. 3.2 g/cm³) |
Behavior |
|---|---|---|
|
0.30–0.35 g/cm³ |
89.1–90.6% |
Lower pressure drop, higher permeability, but thinner struts that break and collapse more easily |
|
0.35–0.45 g/cm³ |
85.9–89.1% |
Balanced permeability, strength, and dimensional stability; the practical middle for most casting operations |
|
0.45–0.50 g/cm³ |
84.4–85.9% |
Stronger skeleton, better impact and thermal shock resistance, but flow and pressure drop can suffer |
Higher density does not mean higher permeability. Mechanical strength tracks with density and strut strength, while permeability depends on pore size and channel connectivity. Two filters with identical volume density can show very different flow behavior if their pore size distribution differs. Published permeability data for porous SiC exceeds 10⁻¹² m², but that figure is meaningless without matching pore size, thickness, and test pressure differential.
What to Demand on the Specification Sheet
For any filter porosity grade decision, push your supplier for:
– Air permeability (m²) and pressure drop–flow curves at realistic flow rates (10, 20, 30 L/min)
– Average pore size, pore size range, and distribution
– Open porosity vs. total porosity, calculated separately
– Room-temperature compressive strength from at least 5 samples
– Thermal shock results: 1200°C to room temp, 3 cycles minimum, with post-cycle strength retention and crack photos
Porous SiC foam at 10–20% relative density typically shows 0.2–2.0 MPa compressive strength, while 30–40% relative density reaches 5–20 MPa, though forming methods, pore size, and bonding systems create wide variation. Commercial 0.30–0.50 g/cm³ products carry ratings up to 1540°C with 1200°C-to-ambient thermal shock cycling, but temperature limits alone do not predict service life. Require actual post-cycle strength retention data and crack-rate photos before issuing a purchase order rather than relying on a theoretical density rating.
PPI (Pore Density) Parameter Breakdown and Selection Reference Table
Ten PPI and fifty PPI look like a rounding error on a spec sheet, but in a running gating system, they are two completely different products. Pores per inch measures how many pore openings sit along one inch of the filter face. That single number directly dictates flow rate, pressure drop, and inclusion capture.
PPI, Pore Size, and Flow at a Glance
|
PPI |
Typical Pore Size |
Relative Flow |
Primary Use |
|---|---|---|---|
|
8–10 |
~1,500–2,000 μm |
Very high |
Gray/ductile iron, thick-wall high-flow castings, aluminum ingot pre-filtration |
|
15–20 |
~700–1,300 μm |
High |
Routine iron, steel, and aluminum filtration |
|
20–30 |
~600–1,000 μm |
Medium-high |
Precision copper alloys, aluminum structural parts |
|
30–40 |
~300–800 μm |
Medium |
High-quality aluminum, thin-wall castings |
|
40–50 |
~200–500 μm |
Medium-low |
Precision casting, aerospace-grade surface finish |
|
50–60 |
~420 μm pore pitch |
Low |
High-cleanliness, low-inclusion, small-batch premium parts |
PPI is not a universal yardstick. It states an average pore count rather than a measured opening size. Strut geometry, ceramic slurry formulation, and sintering shrinkage alter the true pore size within the same rated PPI. That is why two suppliers selling 20 ppi filters can deliver pore openings anywhere between 700 and 1,300 μm. Ask for microscopy pore-size data, porosity, thickness, and a flow curve before buying on the PPI label alone.
Selection by Alloy and Pour Condition
|
Alloy / Condition |
Recommended PPI |
Why |
Avoid |
|---|---|---|---|
|
Gray/ductile iron, high flow |
10–20 |
Low pressure drop, fast mold fill |
40+ PPI clogs early |
|
Iron, routine cleanliness |
20–30 |
Balances flow and capture |
High PPI on heavy inclusion loads |
|
Precision copper alloys |
20–30 |
Fine inclusion control, stable pour |
10 PPI misses fine oxides |
|
Aluminum billet/rod, standard |
20–30 |
Common balance zone |
50–60 PPI on dirty recycled melt |
|
High-quality aluminum, thin-wall |
30–40 |
Better oxide and surface control |
10–20 PPI too coarse |
|
Aerospace/precision aluminum |
40–60 |
Maximizes capture; needs full preheat and larger filter area |
High PPI under low metal head |
What Happens as PPI Climbs
Raising PPI shrinks the pore windows, increases internal surface area, and creates more tortuous paths through the ceramic. Flow drops, pressure drop rises, and capture rate climbs. One published dataset shows 30 PPI operating at ~85% efficiency and catching ~40 μm inclusions; 40 PPI reaches ~88% and ~20 μm; 50 PPI hits ~92% and approaches 10 μm. Treat these figures as one vendor’s test results rather than an industry guarantee. Results change with alloy, temperature, and filter thickness.
For aluminum, initial pressure drop on a Ceramic foam filter runs between 1.5 and 3.5 kPa, shifting with metal temperature, filter area, pour rate, and progressive clogging. A 40 PPI, 25 mm-thick aluminum filter needs 40–80 mm of metal head pressure before breakthrough flow starts. Without that head pressure, the pour stalls or leaves the mold partly filled. Unit-area flux at 40 PPI can fall to 0.05–0.08 kg/(min·cm²), well below 30 PPI throughput, depending on filter structure and melt condition.
Clogging Risk Stacks, It Doesn’t Average
Risk builds up fast when high PPI, thick filter sections, heavy inclusion load, low pour temperature, and long pour times occur during the same pour. For high-impurity recycled aluminum, foundries hold PPI at 20–30 and widen the filter area instead of ordering finer pores. Adding filter area handles a heavy inclusion load far better than raising PPI.
PPI Alone Doesn’t Predict Filtration Efficiency
Capture in a production mold depends on pore-size distribution, pore channel geometry, filter thickness, filter area, melt temperature, flow velocity, and inclusion wettability. A filter is a 3D tortuous network. Particles stick to internal surfaces, collide through inertia, and settle into deep-bed traps, rather than hitting a wall because the pore is physically too narrow. At a fixed PPI, a thicker filter or a slower flow extends contact time, but it also increases pressure drop. No filter fixes skipped degassing, poor dross skimming, or inadequate melt treatment. If you force a high-PPI filter on dirty metal, flow cuts off long before the melt runs clean.
Procurement checklist for PPI claims: PPI tolerance, actual pore-size distribution, porosity, thickness, material grade (alumina/SiC/zirconia), rated flow or pressure drop curve, recommended alloy, rated temperature, filter area, and batch-to-batch consistency.
SiC Material Grade & Purity Standards

“99% SiC” means almost nothing on its own, because the foundry filter industry lacks a single global grading standard. Suppliers categorize materials by production process, bonding phase, and intended application. SSiC (sintered), SiSiC/RBSiC (reaction-bonded), RSiC (recrystallized), and NSiC (nitride-bonded) perform differently in molten metal, even when purity figures look identical on paper.
Purity Numbers Hide the Real Story
Raw SiC powder comes in standard grades: 95#, 97#, 98#, and 99#, representing ≥95%, ≥97%, ≥98%, and ≥99% SiC content. Powder purity does not equal finished-part purity. Reaction-bonded SiC retains 8%–15% free silicon, whereas sintered SiC runs near 0%. That residual silicon sets the maximum operating temperature and dictates how the component reacts with aggressive melts.
Ask for a batch-level breakdown covering SiC phase content, free silicon, free carbon, oxide impurities, and bonding agent content. Verify the bonding chemistry as well, whether it relies on Al₂O₃, SiO₂, clay, silicate, phenolic resin, or Si₃N₄, along with the crystal structure (α-SiC or β-SiC, commonly 6H-SiC).
Bonding System Determines Temperature Ceiling
|
Bonding Type |
Typical Max Temp |
Risk Profile |
|---|---|---|
|
Oxide-bonded |
1000–1400°C (up to ~1500°C for high-purity formulas) |
Low cost; glass phase softens at high temp, causing strength loss and pore blockage |
|
Resin-bonded |
300–800°C continuous |
Weak long-term choice for molten metal filtration |
|
Reaction-bonded SiSiC |
1350–1380°C |
Limited by free silicon; strong and dimensionally stable |
|
Sintered SSiC |
~1600°C in air |
Near-zero free silicon; best high-temp strength and corrosion resistance |
|
Recrystallized RSiC |
~1650°C |
No free silicon; excellent thermal shock resistance, lower room-temp strength |
|
Nitride-bonded NSiC |
~1470°C |
Good thermal stability; verify oxidation behavior under service atmosphere |
Compressive strength should reach ≥2.0 MPa for standard SiC Foam filters at room temperature, while dense, low-porosity structures hit 50–200 MPa. Never evaluate strength across different porosity levels side by side. For thermal shock resistance, require at least 5–10 cycles from working temperature to ambient without through-cracks; published foam filter data often cites 6 cycles from 1200°C to room temperature as a benchmark.
Resin-bonded products require debinding curves, residual carbon rates, and hot-strength data. Room-temperature measurements tell you nothing about service life in continuous molten metal filtration. Always demand a COA with test standards, sample sizes, and batch numbers before signing off on any material property claim.
Matching Filter Parameters by Metal Type (Selection Decision Table)
Five alloy families need five different filter strategies. Density, melt temperature, and expected inclusion load rarely align, so a single default PPI never survives contact with a working foundry floor. Here is how the numbers break down by metal type.
Starting Point by Alloy
|
Metal Type |
Typical Density (g/cm³) |
Starting PPI |
Common Filter Material |
Selection Focus |
|---|---|---|---|---|
|
Gray iron |
6.9–7.3 |
15–20 PPI |
SiC |
High temp, high flow volume; thin-wall or high-cleanliness parts can evaluate 20–25 PPI |
|
Ductile iron |
7.0–7.4 |
10–15 PPI |
SiC |
Graphite nodules, slag, and high metallostatic head favor flow capacity first; raise to 15–20 PPI as cleanliness demands increase |
|
Malleable iron |
7.1–7.4 |
10–15 PPI |
SiC |
Similar to iron conditions; heavy sections and long pour times favor lower PPI, precision parts can use 15–20 PPI |
|
Copper alloys (Cu/bronze/brass) |
8.3–8.9 |
15–20 PPI |
SiC, alumina, or composite ceramic |
High melt temp and density require balancing thermal shock strength with pressure drop; fine inclusion control can push to 20–30 PPI |
|
Aluminum alloys |
2.55–2.85 |
20–30 PPI |
Alumina (Al₂O₃) |
Standard gravity casting runs 20–30 PPI; high-cleanliness, thin-wall parts can use 30–40 PPI |
Stepping up to a higher PPI always involves the same trade-off. You get smaller pores and tighter inclusion capture, but you take on higher flow resistance, greater clogging risk, and the need for more metal head.
Why Aluminum Casting Filter Choices Default to Alumina, Not SiC
Aluminum pours at 680–780°C. alumina filters handle up to 1100°C without issue, which gives you plenty of thermal headroom, resists aluminum melt, and costs less than SiC. SiC still holds the edge on thermal conductivity, mechanical strength, and high-temperature durability, which matters when pours run hotter, thermal shock is severe, or the filter bears a heavy metallostatic load.
However, molten aluminum wets SiC better than Al₂O₃. Because of this, alumina filters often demand thorough preheating and sufficient starting head before metal flows through them. Preheat Ceramic Foam Filters for aluminum to at least 300°C, aiming for 400–600°C in production. Check the exact target with your supplier and your specific pour setup.
Decision Variables That Override the Starting PPI
|
Decision Variable |
Effect on Filter Spec |
Specific Rule |
|---|---|---|
|
Pour temperature |
Sets material temperature ceiling, thermal shock margin, preheat requirement |
Aluminum (680–780°C): alumina first. Copper alloys (~1000–1200°C): alumina/mullite or SiC. Gray/ductile iron (~1300–1450°C): SiC. |
|
Metallostatic head |
Sets liquid column pressure, flow velocity, allowable pressure drop |
High head, large pour volume, or short pour time: favor lower PPI and larger filter area. A 30 PPI aluminum filter needs at least 100–150 mm of metal head above it. |
|
Casting cleanliness requirement |
Sets pore size, PPI, and filter area |
Standard sand mold/high flow: 10–20 PPI. Standard aluminum: 20–30 PPI. High-cleanliness, thin-wall, precision parts: 30–40 PPI or higher, but area or head must increase to offset pressure drop. |
Practical Decision Sequence
-
Fix material by temperature first. Aluminum defaults to Al₂O₃. Iron defaults to SiC. Copper alloys split between Al₂O₃, SiC, or composite grades depending on pour temperature and thermal shock exposure.
-
Fix PPI by cleanliness target second. A lower PPI protects flow rate, while a higher PPI catches more inclusions.
-
Verify filter area against head pressure and pour time last. Never try to fix a high-flow or high-viscosity pour by increasing PPI alone. Enlarge the filter area instead.
-
Troubleshoot in this order. When you face slow startup, metal hanging up at the gate, or early clogging, check your preheat, filter area, and metal head before switching to a finer PPI.
Comparative Analysis of SiC Filters vs. Other Filter Materials
Four filter materials compete for gating systems, and only silicon carbide handles molten iron reliably. Choosing between SiC, alumina, glass fiber mesh, and Ceramic honeycomb comes down to temperature margin, wear life, and total cost per accepted casting.
Material-by-Material Breakdown
|
Material |
Max Temp |
Strength/Thermal Shock |
Price Range |
Best Fit |
|---|---|---|---|---|
|
SiC foam |
~1,560°C |
Low thermal expansion, strong shock resistance; wear life reaches 2–3× alumina in high-abrasion service |
$0.85–48/pc; standard $1.2/pc; custom/large $9.72–12.50/pc |
Gray/ductile iron, copper, brass, bronze; high-velocity pours |
|
Alumina foam |
~1,200–1,250°C |
Stable for aluminum; lacks thermal shock margin for iron, risking brittle cracks |
Under SiC; $0.4–15.5/pc |
Aluminum gravity/low-pressure casting, wheels, semi-continuous casting |
|
Glass fiber mesh |
700–1,700°C (depends on coating) |
Low rigidity, prone to softening or rupturing under sustained high heat |
As low as $0.08–0.15/pc (MOQ 1,000) |
Low-temp, low-pressure, short-run aluminum pours |
|
Ceramic honeycomb |
~1,390°C |
Straight channels, low pressure drop; cracks under localized clogging or thermal shock |
Above glass fiber, below premium SiC |
Aluminum, copper, some iron where low pressure drop matters |
Standard pore ratings across these materials run 10–60 PPI, trapping 10–50 μm particles with filtration efficiency near 95%. Actual capture rates depend on your chosen PPI, total filter area, preheat, and seal quality.
When the SiC Premium Pays Off
Pay for SiC when melt temperatures approach alumina’s ceiling, flow velocity is aggressive, or filter failure risks a scrapped casting or line stoppage. Skip it for standard 700–750°C aluminum gravity pours with low flow, where cheap disposable filtration does the job. Benchmark aluminum against alumina or glass fiber, copper alloys against SiC or honeycomb, and iron against SiC by default. Base your purchasing on the cost per good casting.
Purchase Verification Checklist and Common Selection Pitfalls

Most rejected batches trace back to paperwork gaps rather than pouring mistakes. Before issuing a purchase order, verify that the filter matches the claimed specification with actual test documentation rather than relying on a marketing datasheet.
What the Supplier Should Hand Over
-
Product specification sheet: material grade (SiC), PPI range, length/width/thickness or diameter, tolerances, open porosity, volume density, compressive strength, max working temperature, and recommended alloy.
-
Density report, batch by batch: check declared volume density against the published 0.35–0.50 g/cm³ range for SiC foam filters.
-
PPI distribution data: measured PPI spread, sample size, pass/fail criteria, and the batch out-of-tolerance rate instead of a nominal “20 PPI” label. The standard supply range covers 8–30 PPI.
-
Thermal shock certification: test temperature, cooling medium, cycle count, sample dimensions, and failure criteria. A standard benchmark is 1200°C to room temperature across 6 cycles.
-
Working and softening temperature report: maximum working temperature near 1500°C, with softening temperature on certain products rated at 1360°C or higher.
-
Permeability and pressure-drop curves: air permeability or metal flow versus pressure drop, tied to filter thickness, area, temperature, and test method. PPI numbers alone cannot predict actual flow.
-
Compressive strength report: room-temperature dry values alongside preheated or high-temperature data; the common benchmark sits at ≥1.2 MPa.
-
Dimensional and visual inspection records: length, width, thickness, roundness, chipped corners, cracks, and blocked-pore ratios.
-
Batch traceability files: melt lot number, production date, furnace heat, raw material lot, inspector ID, packaging labels, and retained samples.
-
Alloy-fit proof: separate PPI, temperature range, and flow figures for cast iron, ductile iron, and copper alloys. SiC works as the standard for these metals at operating temperatures up to 1500°C.
Common Selection Mistakes
|
Mistake |
Consequence |
Fix |
|---|---|---|
|
Selecting by PPI alone |
Higher PPI filters finer particles but increases flow resistance, causing short pours, rising metal levels, or cracked filters |
Compare PPI against permeability, thickness, total filter area, and pressure-drop curves; run a trial pour before full production |
|
Ignoring real pour temperature |
Thermal shock cracking, dross shedding, or localized clogging on first metal contact |
Match the filter rating to actual pouring temperature, preheat conditions, and expected thermal drop; a catalog 1500°C rating does not replace direct thermal shock testing |
|
Overlooking batch-to-batch permeability variance |
Flow rate, pressure drop, and service life swing between batches on the “same” spec |
Test air permeability or melt flux on incoming lots; enforce deviation limits such as ±10% against the initial baseline |
|
Checking outer dimensions instead of net filter area |
The filter fits the print, but the active filtration zone is too small, choking flow |
Deduct gate contact surfaces, seating edges, and clogging margins to determine true net area, then check it against unit-area flux |
|
Treating compressive strength as thermal shock resistance |
Static strength passes, but the filter still fractures on impact during the pour |
Evaluate compressive strength, thermal cycling, melt impact, and trial pours as four independent acceptance metrics |
|
Carrying aluminum logic over to iron or copper |
Mismatched temperature, viscosity, and inclusion loads cause pressure drop and life failures |
Request alloy-specific test data; baseline trials usually start at 10–20 PPI for cast iron and 20–30 PPI for ductile iron |
Sizing the Filter Correctly
Run the numbers before locking in a filter size:
-
Volume flow rate: Qv = m / (ρ·t), where m is metal mass through the filter, ρ is melt density, and t is effective pour time.
-
Minimum area: A_min = Qv / v_allow, or by mass flow, A_min = ṁ / G_allow. Historical data for ceramic foam filters lists 5–50 in³/in²·min, while aluminum operations typically run 10–30 in³/in²·min. For iron and copper alloys, use supplier-verified curves rather than general benchmarks.
-
Pressure-drop check: ΔP_filter + ΔP_gating ≤ ΔP_available, calculated through supplier curves or ΔP ≈ K(μLv/k) + Cρv². Lower pour temperatures raise liquid viscosity, which requires reducing your target flow rate.
-
Recommended size: A_recommend = (Qv / v_allow) × S. Use a safety factor of 1.2–1.5 for initial trials, and increase it for heavy inclusion loads, lower pouring temperatures, or extended pour times. Beyond calculated area and pressure drop, the final size must account for seating clearance, seal support, and thermal shock test results.
Conclusion
Getting molten metal filtration right comes down to three numbers: density, PPI, and material grade, and none of them work in isolation. A high-density sic filter with the wrong pores per inch (PPI) rating will choke your flow rate, while a low-grade filter lets inclusions slip straight into your castings. Choosing the right foundry filter material grade means matching all three variables to your actual alloy, pouring temperature, and gating system.
Before you place your next order, pull up your current defect reports and cross-check them against the selection tables above. If you’re seeing recurring inclusion issues or inconsistent fill rates, have a technical conversation rather than guessing.
FoundryMax engineers work with foundries to validate filter specs against real production conditions. Reach out for a sample evaluation.